Pagerduty came with up a status dashboard which shows status of your business services , similar to status.io or status.page
The motivation of this page is to get a binary answer (Yes/no) if our core services related to business are healthy or not. We might have millions of alerts defined but this page is a simple summary page to tell us the answer to a question that business team generally asks – Are we up or down ?
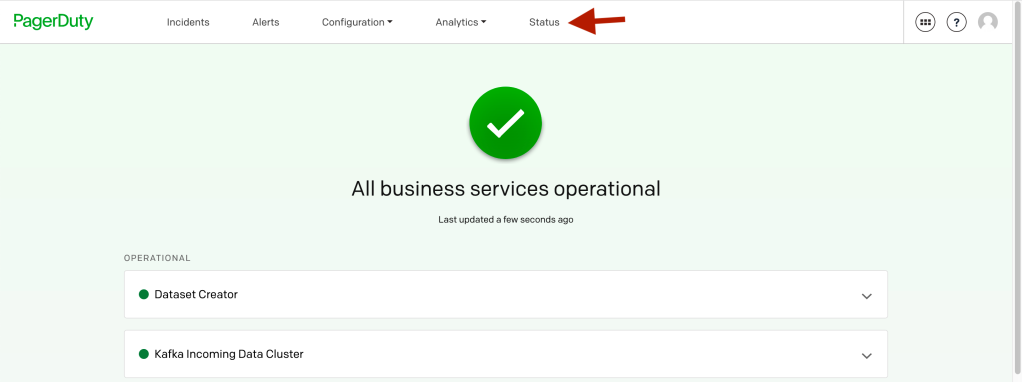
In the above we have 2 business services which are operational for the moment.
The above business services show up on the status because they meet the following criteria:
- The pagerduty alerts attached to these business have a Priority set .
- If an incident is open with a priority at or above the priority set in business service settings.

At my current org eyeota.com, we have our alerting done via prometheus alert manager and its hooked up to pagerduty.
But for most of our rules defined in prometheus, I did not find an easy way to set priority on the alert being generated that Pagerduty would understand directly.
Below we have a simple prometheus rule to check if all kafka brokers are down or not.
groups:
  - name: kafka_cluster_status
    rules :
      - alert: all_kafka_brokers_down
        expr: sum(up{instance=~".*:9213",role="kafka", job="kafka"}) == 0
        for: 5m
        labels:
          level: app
          region: '{{ $labels.region }}'
          service: '{{ $labels.job }}'
          severity: high
        annotations:
          summary: "All kafka brokers are down (instance {{ $labels.instance }}). PD_PRIORITY_P1"
          description: "All kafka brokers have been down for more than 5 minute."
If you notice, you see the notion of severity but not priority. Now you wonder if I use severity for my cause to fulfill one of the two criteria mentioned above.
The answer is yes, you can use it. but …
this depends on your environment, if you have a lot alerts classified as high and want to differentiate within them as to what is the most important, then it might be tough.
This is the case for us, we have many high severity ones, but also want to rank whats the most important. So I thought we could use priority P1 to tell people things are on fire i.e = defcon1
If you notice in the above rule, i have tucked in the key word ‘PD_PRIORITY_P1’ in one of the annotations.
I shall use this to my advantage to tell pagerduty to set priority P1 when the alert is fired.
How do i do this ?
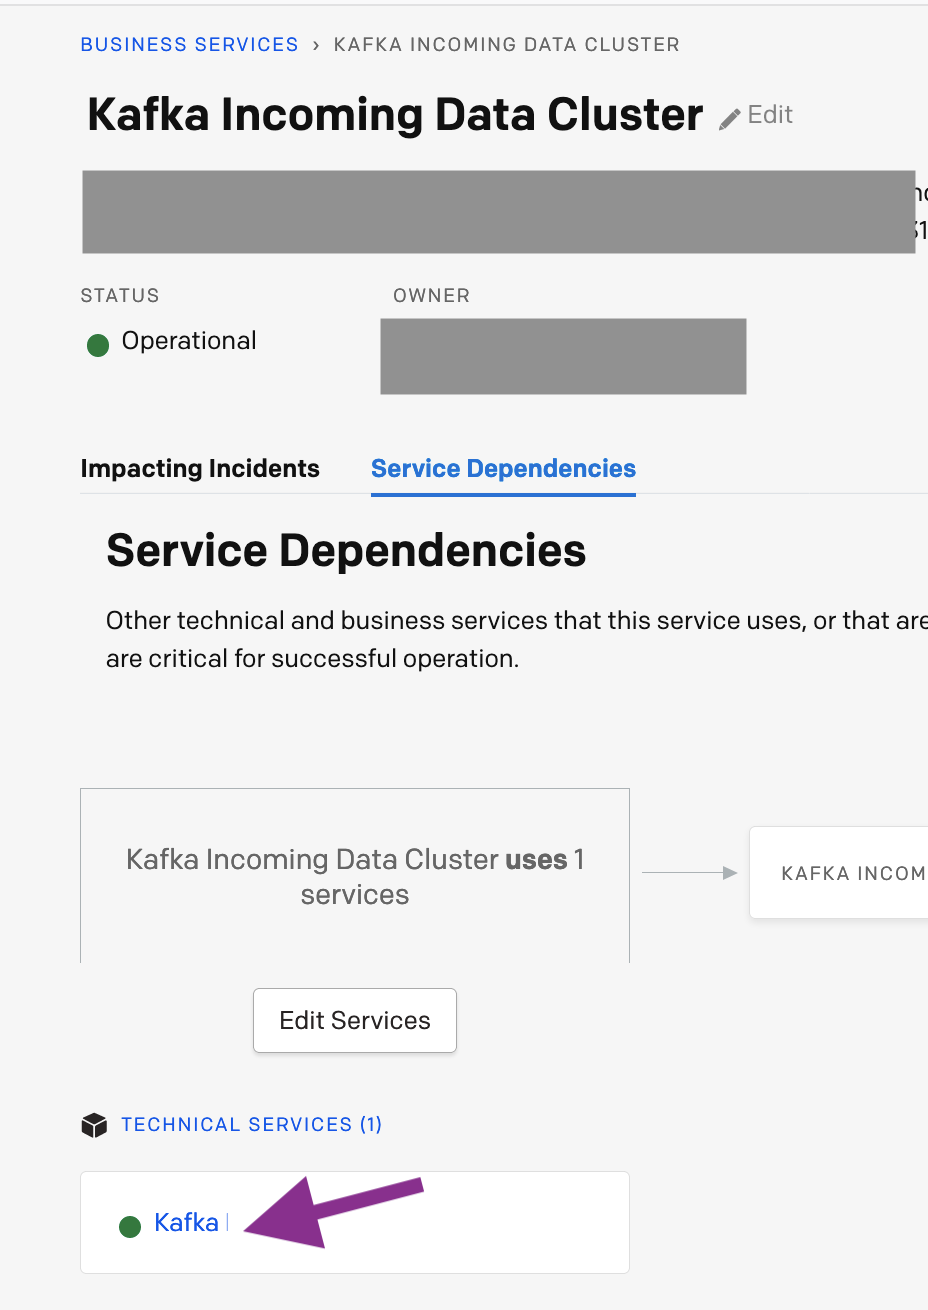
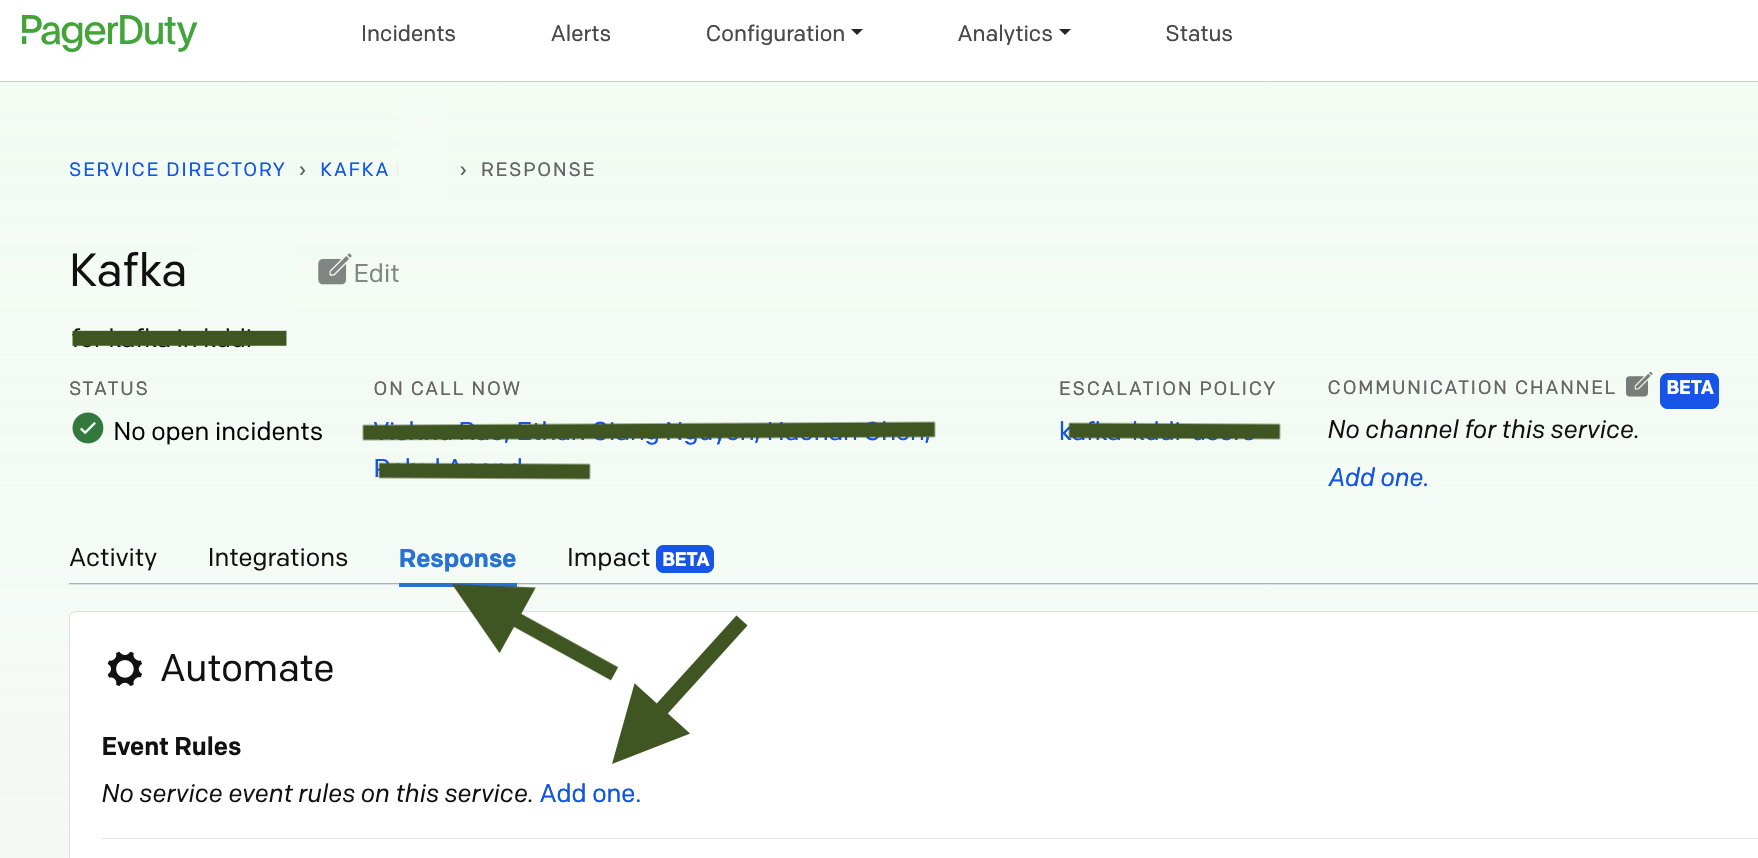
- Go to the supporting technical service of your business service i.e.
- Then go to Response and click on Add Rule:
3. Add a rule 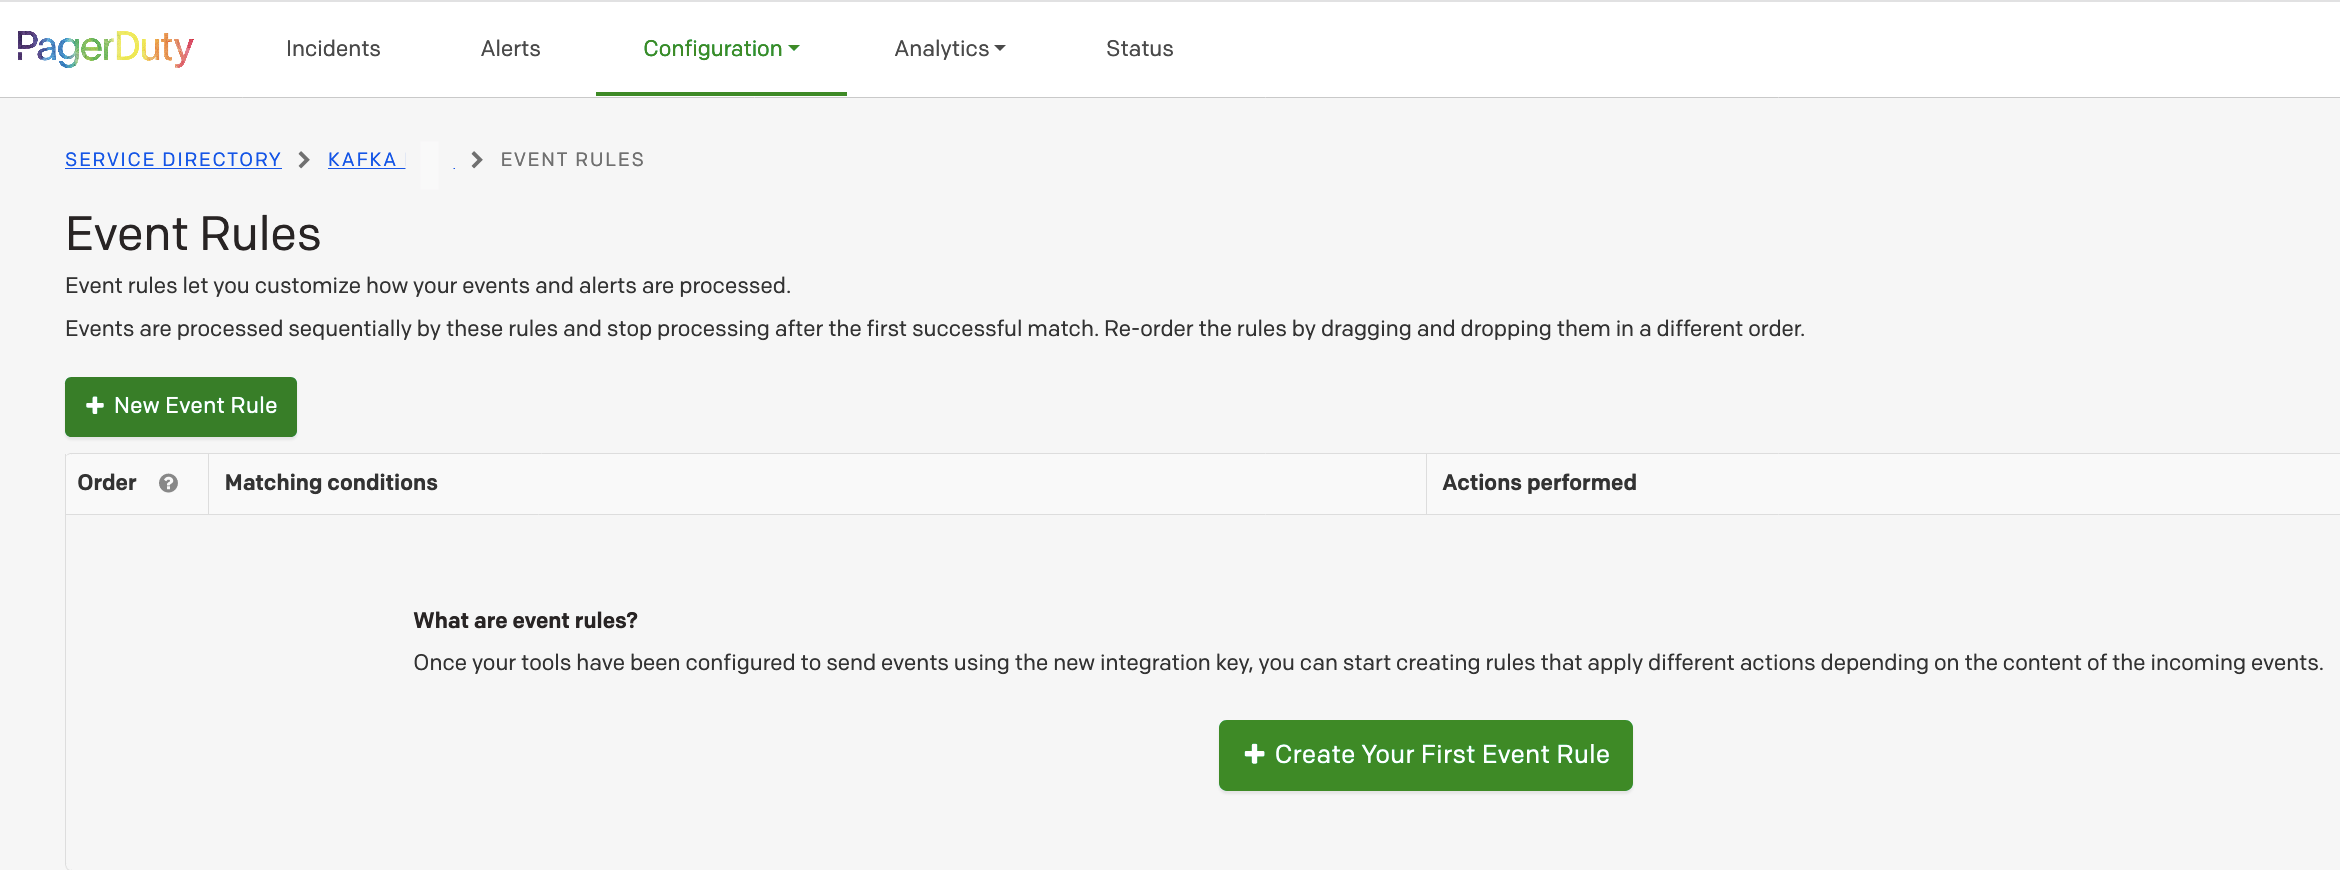
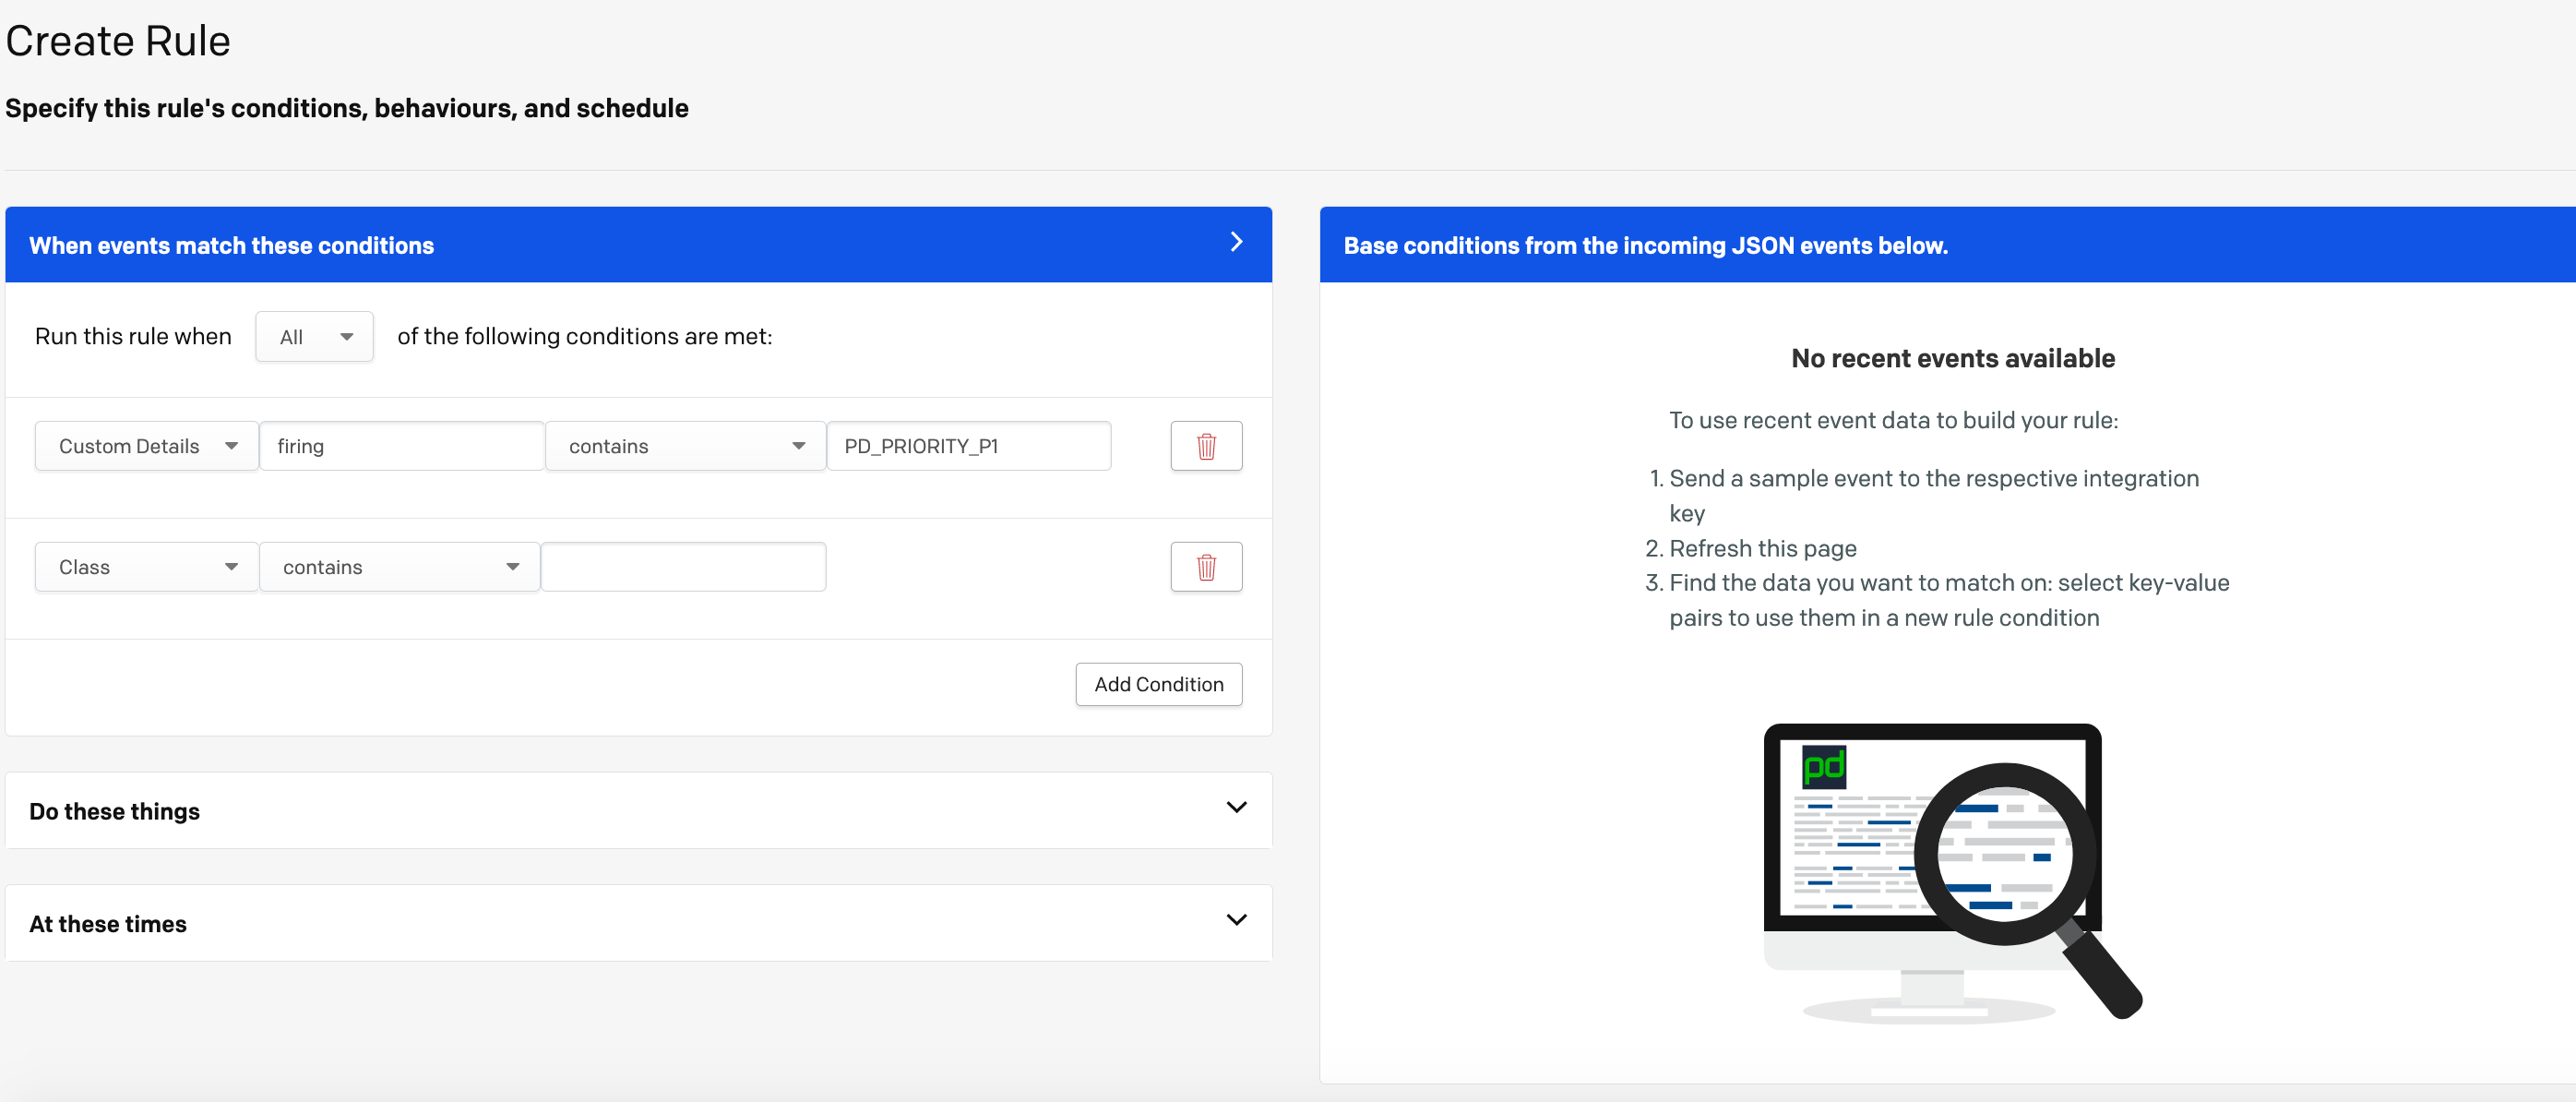
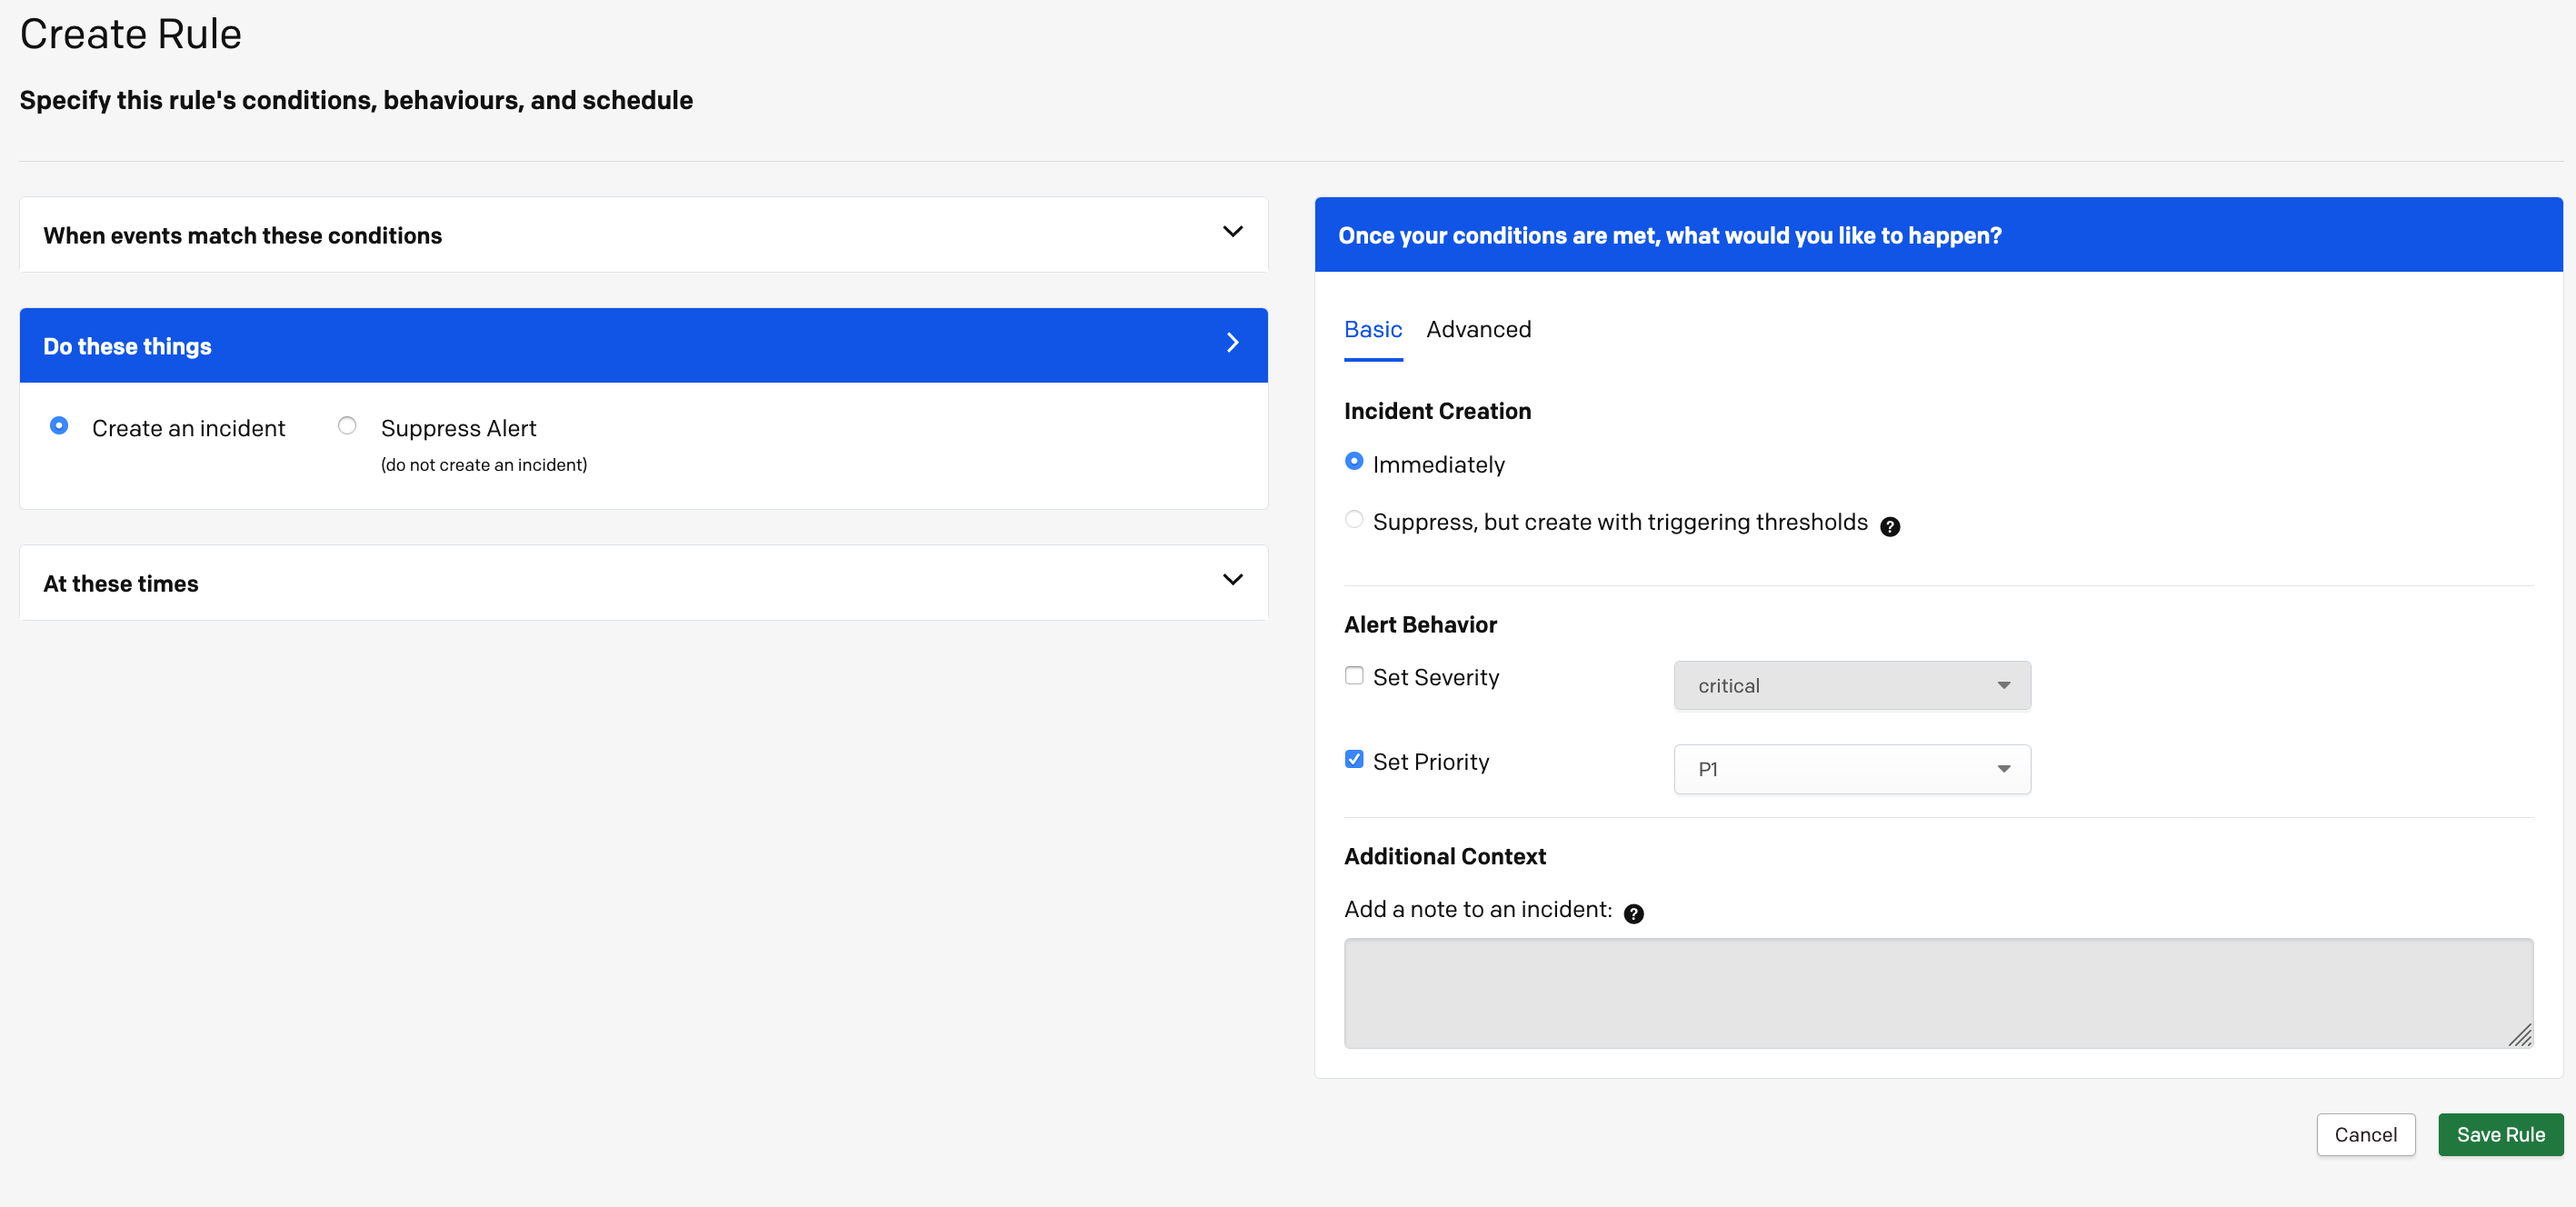
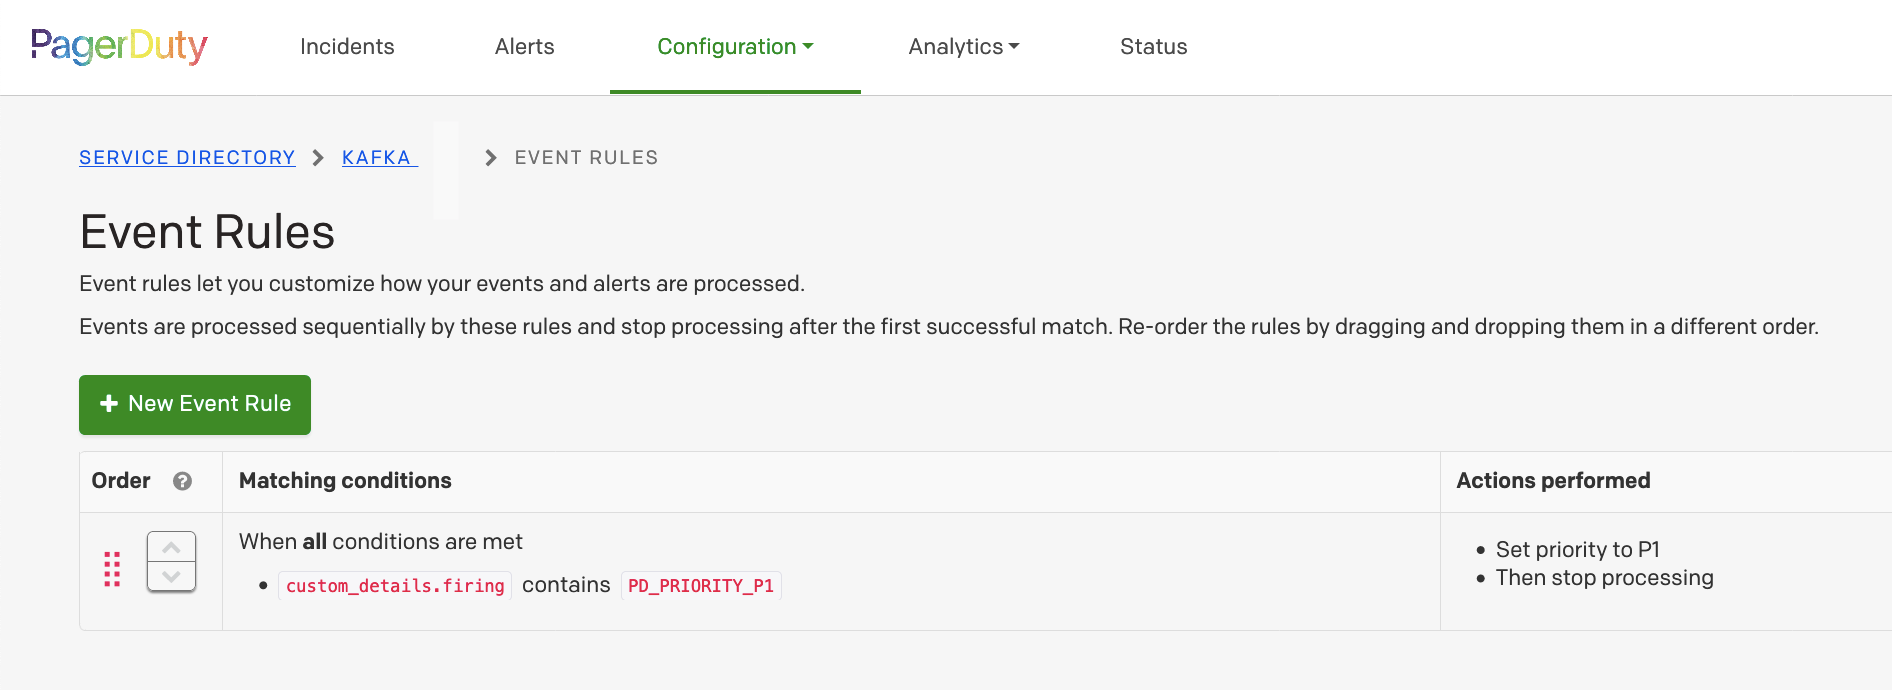
Now This event rule will apply to our prometheus rule we defined because I included the word ‘PD_PRIORITY_P1’ and set priority P1.
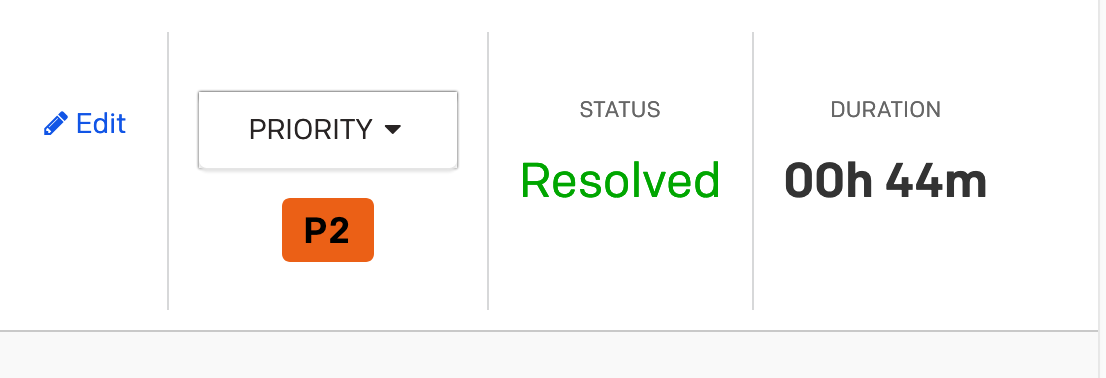
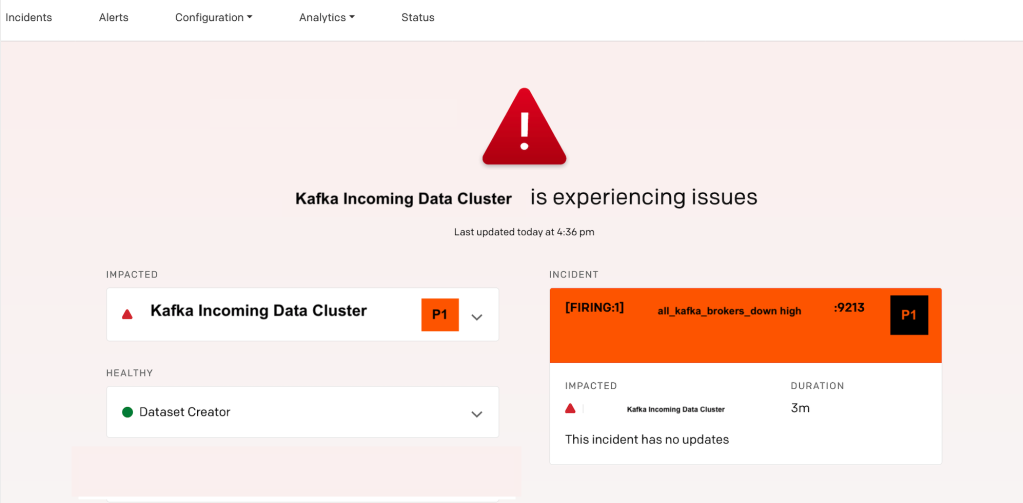
Since P1 > P2 (our alert threshold set in business service settings), the status dashboard will now reflect and show something like this :
PS: You can use this solution idea to set priority on any kind of alert from any source, not necessarily prometheus.
Well this is the end of this blog post we have successfully connected our prometheus alert to a pagerduty business status dashboard by setting priority via event rules.
Hope this is useful to you.
Ps: as always any feedback is useful.
& i hope you sing & dance to this song when you are oncall 🙂 and hope not to see a red dashboard.
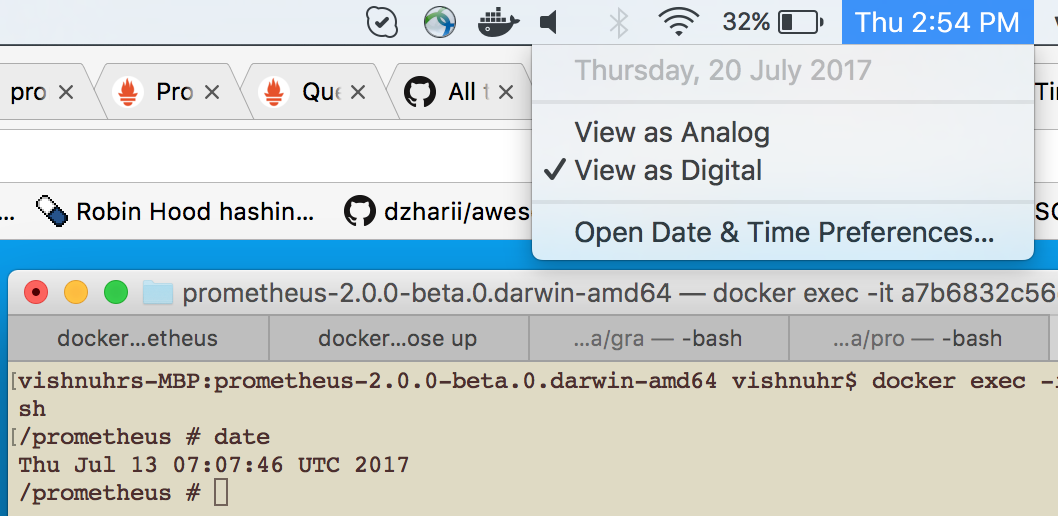
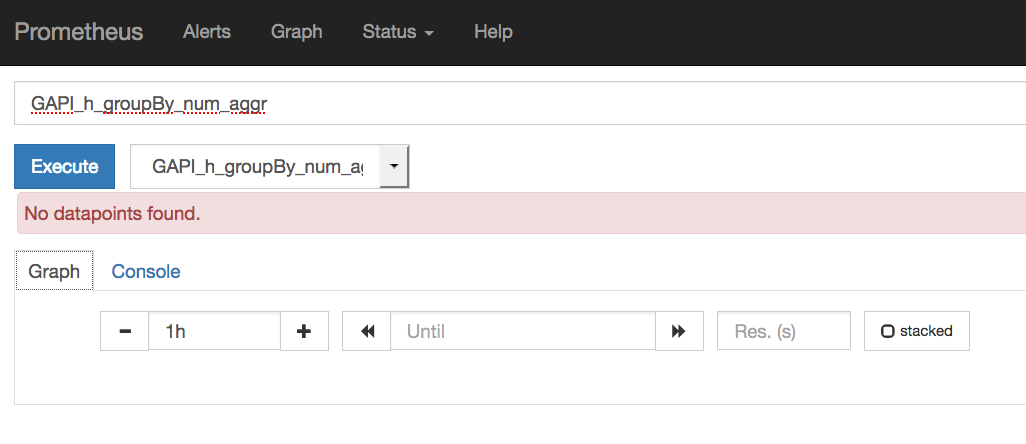 There were no errors in prometheus and i was scratching my head …. grrr…