SparkException: Parquet column cannot be converted in file

SparkException: Parquet column cannot be converted in file

Got the error while reading nyc yellow taxi data…


24/04/09 16:15:12 INFO FileScanRDD: Reading File path: /nyc_yellow_cab_data/2015/12/yellow_tripdata_2015-12.parquet, range: 0-134217728, partition values: [empty row]
24/04/09 16:15:12 WARN TaskSetManager: Lost task 4.0 in stage 2.0 (TID 101) (192.168.0.2 executor driver): org.apache.spark.SparkException: Parquet column cannot be converted in file file:nyc_yellow_cab_data/2015/04/yellow_tripdata_2015-04.parquet.

Column: [congestion_surcharge], Expected: double, Found: INT32.at org.apache.spark.sql.errors.QueryExecutionErrors$.unsupportedSchemaColumnConvertError(QueryExecutionErrors.scala:868)


The parquet directory containing the data with has files with different schemas.

i.e. one file above has congestion_surcharge with type DOUBLE and another file has Type INT32.

hence the mismatch. Fix the files.

you can try mergeSchema = true, but in this case it wont work.

Making github workflows a little Joyful

Recently at work, i came with a project called Seeds – Its a curated/prepared dataset which we send through our pipeline and at the end of it, we verify the expected vs actual results.

Expected You say ? – since the dataset is custom prepared by us, we are aware of its nature and hence know what to expect. Example: Prepare a dataset of 100 orders for customer ‘Adam’ and push it thru your pipeline. I expect select count(*) from orders where customer =’Adam’ ==== 100 at the end of the pipeline.

So i came up with Harvestor, its a github workflow which does the pipeline setup, plants the seeds (send the data) and does various verification steps at various checkpoints in the pipeline. At the end, it verifies the Harvest, i.e the final result.

The normal github pipelines looked 🥱☹️, So i sprinkled a little Emojis to brighten up the place 🤗

The project naming also resonated well with my team mates too!

That combined with nice icons for slack channel – made the cake complete with cherries.

I call this DATA Art or DartA.

let me know what you think. Hope this inspires you.

Lambda to Dedup less data – Spark vs OwnSolution

Lambda to Dedup less data – Spark vs OwnSolution

Hi guys,

Some data pipelines typically have a DeDup phase to remove duplicate records.

Well I came across a scenario where

  • the data to dedup was < 100Mb
  • Our company goes with a Serverless theme
  • + we are a startup so fast development is a given

So naturally, I thought of

  • Aws Step Functions (to serve as our pipeline) – as input data is < 100MB
  • Lambda for each phase of the pipeline
    • Dedup
    • Quality check
    • Transform
    • Load to warehouse

Now for the Dedup lambda (Since i have used Spark before) I thought it would be like 3 lines of code and hence easy to implement.

Dataset<Row> inputData = sparkSession.read().json(inputPath);
Dataset<Row> deduped = inputData.dropDuplicates(columnName);
deduped.write().json(outputPath);
//using spark local mode - local[1]

I packaged it and ran the lambda … it took > 20 seconds for 10mB of data ☹️

This got me thinking 🤔…. this sounds like overkill

so I decided to write my own code using python (boto3 for s3 interaction + simple hashmap to dedup)

That is a 92.8% decrease 😮 in running time lol

so lets summarize

Apache Spark (local mode)Own Solution (python boto3 + hashmap)
code
effort
very low (spark
does everything)
medium (have to write code to
download + dedup + upload to s3)
Mem requirements >=512 MB (spark needs min 512)<128 MB
Mem Used600MB78 MB
Running time Sec23.7 ❌1.7 ✅

Moral of the Story

  • When you think data pipelines, don’t always go to Apache Spark
  • Keep in mind the amount of data being processed
  • Less code is good for code maintenance but might not be performant
    • i.e. Ease of development is a priority but cost comes first.
  • Keep an eye on cost $ 💰
    • Here we have decreased cost by 92% as lambda bills per running time & memory used
Golang & Kubernetes – may not be a smooth ride sometimes

Golang & Kubernetes – may not be a smooth ride sometimes

Theses days many teams have deployed apps via kubernetes. At my current workplace eyeota, we recently moved one of our golang apps to kubernetes.

We have a simple golang application which read messages from kafka, enriched them via a scylla lookup & pushed the enriched messages back to kafka.

This app had been running well for years, until the move to kubernetes, we had noticed that kafka lag started to grow at a high rate. During this time, our scylla cluster had been expierencing issues & obviously db lookups were taking time, which had contributed to delayed processing/kafka lag.

Our devops team had added more nodes to the scylla cluster in an effort to decrease the db slowness, but the lag continued to grow.

Steps to Mitigate:

  1. Increasing numbe of pods : we increased from 4 to 6 pods. This did not help much.
  2. Reduce Db timeouts/retries: This did not help that well either

Further Analysis of Metrics Dashboard:

This time I chose to have a look a the kubernetes dashboard and found that one particular metric was strange

kubernetes cpu pod throttling” !

When i checked other apps, this metric was quite low but not for my app. It would seem that kubernetes is throttling my app.

Fix

Based on this golang bug (runtime: make GOMAXPROCS cfs-aware on GOOS=linux), it would seem that golang did not respect the quota set for it in kubernetes i.e. golang was setting GOMAXPROCS to a value greater than quota.

We run a lot of go-routines in our code !

To workaround this, we needed to import the ‘uber golang automax-procs‘ lib in our code which make sure that golang was setting GOMAXPROCS according to the kubernetes cpu quota set.

i.e. a simple one line change

import _ "go.uber.org/automaxprocs"

Walah, pushed the change and deployed it.

The effects were as follows:

  1. Pod Throttling metric decreased ⬇️ ✅

2. Golang GC times decreased ⬇️ ✅

3. Kafka Message Consumption increased ↗️ ✅ & Lag decreasing ↘️✅

After the fix was deployed, we noticed an increase in msg consumption. On increasing the number of pods from 4 to 8 (note: pod quotas remained unchanged), we noticed that consumption increased even more (horizontal scaling was working).

Lag also began to drop nicely 😇.

Recommendation:

If you are using golang, Do check if pod throttling is occuring. You might be happy with our app even if its happening, but if its removed , it can do better 😀


Any feedback is appreciated. Thanks for reading.

ps: golang version 1.12, kubernetes version v1.18.2 on linux

Effect of Not Closing http response body – golang

Effect of Not Closing http response body – golang

We at eyeota were investigating the performance of one of our golang services & came across one of the common gotchas/traps which we happened to fall into.

resp, err := httpClient.Get(url)
if err != nil {
     log.Println(err)
     return
}
//always do this - close the body
defer func() {
    if resp != nil && resp.Body != nil {
	if err := resp.Body.Close(); err != nil {
            log.Println(err)
	}
    }
}()

By NOT closing of the response body – it lead to the following consequences:

  1. high number of file descriptors => leak
    1. high memory usage
    2. high number of go routines

As you can see, the effects were very significant.

Learnings:

  • read the go docs properly 🙂
  • Keep an eye of File descriptors
PagerDuty Status dashboard linked to Prometheus Alert Manager alerting.

PagerDuty Status dashboard linked to Prometheus Alert Manager alerting.

Pagerduty came with up a status dashboard which shows status of your business services , similar to status.io or status.page

The motivation of this page is to get a binary answer (Yes/no) if our core services related to business are healthy or not. We might have millions of alerts defined but this page is a simple summary page to tell us the answer to a question that business team generally asks – Are we up or down ?

In the above we have 2 business services which are operational for the moment.

The above business services show up on the status because they meet the following criteria:

  1. The pagerduty alerts attached to these business have a Priority set . undefined
  2. If an incident is open with a priority at or above the priority set in business service settings.

At my current org eyeota.com, we have our alerting done via prometheus alert manager and its hooked up to pagerduty.

But for most of our rules defined in prometheus, I did not find an easy way to set priority on the alert being generated that Pagerduty would understand directly.

Below we have a simple prometheus rule to check if all kafka brokers are down or not.

groups:
  - name: kafka_cluster_status
    rules :
      - alert: all_kafka_brokers_down
        expr: sum(up{instance=~".*:9213",role="kafka", job="kafka"}) == 0
        for: 5m
        labels:
          level: app
          region: '{{ $labels.region }}'
          service: '{{ $labels.job }}'
          severity: high
        annotations:
          summary: "All kafka brokers are down (instance {{ $labels.instance }}). PD_PRIORITY_P1"
          description: "All kafka brokers have been down for more than 5 minute."

If you notice, you see the notion of severity but not priority. Now you wonder if I use severity for my cause to fulfill one of the two criteria mentioned above.

The answer is yes, you can use it. but …

this depends on your environment, if you have a lot alerts classified as high and want to differentiate within them as to what is the most important, then it might be tough.

This is the case for us, we have many high severity ones, but also want to rank whats the most important. So I thought we could use priority P1 to tell people things are on fire i.e = defcon1

If you notice in the above rule, i have tucked in the key word ‘PD_PRIORITY_P1’ in one of the annotations.

I shall use this to my advantage to tell pagerduty to set priority P1 when the alert is fired.

How do i do this ?

  1. Go to the supporting technical service of your business service i.e. undefined
  2. Then go to Response and click on Add Rule:undefined

3. Add a rule undefinedundefinedundefinedundefined

Now This event rule will apply to our prometheus rule we defined because I included the word ‘PD_PRIORITY_P1’ and set priority P1.

Since P1 > P2 (our alert threshold set in business service settings), the status dashboard will now reflect and show something like this :

All Izz NOT Well

PS: You can use this solution idea to set priority on any kind of alert from any source, not necessarily prometheus.

Well this is the end of this blog post we have successfully connected our prometheus alert to a pagerduty business status dashboard by setting priority via event rules.

Hope this is useful to you.

Ps: as always any feedback is useful.

& i hope you sing & dance to this song when you are oncall 🙂 and hope not to see a red dashboard.

Understanding Docker In Docker with Gitlab CI

Understanding Docker In Docker with Gitlab CI

Have been playing around with gitlab recently and trying to create a build pipeline for my golang app.

So thought of documenting my learnings visually about in docker in docker and interactions in the docker executor of the gitlab runners.

I recommend you read a little about gitlab CI and play around it with a bit to get a feel about the workflow in gitlab.

Lets say we have a project which basically does the following:

  • connects to a httpd server and pulls information.
  • it processes the information and pushes to kafka / mysql

Assume we write the code in golang and write normal tests along with integration tests.

The integration tests rely on a launching httpd server / kafka / zookeeper/mysql as docker containers.


For that lets say we do the following :

  • we have a docker compose which launches kafka / zk only
  • we manually launch the httpd server using ‘docker run’ (we can launch it in docker compose too. but lets do it separately as an exercise for the sake of learning to understand how dockers interact in gitlab ci).
  • we manually launch mysql (we can launch it in docker compose too. but lets do it separately as an exercise for the sake of learning to understand how dockers interact in gitlab ci)

i.e.

  • docker-compose up
  • docker run -t httpd
  • #start mysql somehow
  • go test


Now we come up with a gitlab-CI definition file which specifies 2 stages – test and build docker image for our app.

Here is a sample GITLAB-CI file (you may ignore the details now) but remember we intend to do tests and build docker.

Screenshot 2020-04-24 at 20.56.06

So lets focus on the TEST stage,

  • Every build defined in gitlab-ci.yml file is allocated to a gitlab runner process.


  • Each gitlab runner executes the build using an executor (many types of executors are there).


  • We shall configure our runner to use the docker executor.


The following diagram illustrates what happens when we run the build in gitlab CI.

Screenshot 2020-04-24 at 20.58.01


The above diagram focuses on the TEST_JOB of TEST stage.

Hope the diagram is self explanatory!

PS: hope you noticed the Docker in Docker In Docker

i.e. httpd container in dind container in docker executor container.

Any feedback is welcome.

Install librdkafka on alpine docker

Install librdkafka on alpine docker

Made a few optimizations to reduce the size from 342 MB down to 218MB down to 53MB.

here is the gist to the the docker file.


FROM alpine:3.9
ENV LIBRD_VER=1.3.0
WORKDIR /tmp
#vishnus-MacBook-Pro:librd vrao$ docker images |grep lib
#lib proper_cleanup 675073279e9c 4 seconds ago 53.3MB
#lib cleanup 7456af7df73b 2 minutes ago 218MB
#lib simple 9724aed9519c 7 minutes ago 342MB
######### simple install ################# -> 342MB
#RUN apk add –no-cache –virtual .make-deps bash make wget git gcc g++ && apk add –no-cache musl-dev zlib-dev openssl zstd-dev pkgconfig libc-dev
#RUN wget https://github.com/edenhill/librdkafka/archive/v${LIBRD_VER}.tar.gz
#RUN tar -xvf v${LIBRD_VER}.tar.gz && cd librdkafka-${LIBRD_VER} && ./configure –prefix /usr && make && make install
##########################################
######### cleanup deps ################ -> 218 MB
#RUN apk add –no-cache –virtual .make-deps bash make wget git gcc g++ && apk add –no-cache musl-dev zlib-dev openssl zstd-dev pkgconfig libc-dev
#RUN wget https://github.com/edenhill/librdkafka/archive/v${LIBRD_VER}.tar.gz
#RUN tar -xvf v1.3.0.tar.gz && cd librdkafka-${LIBRD_VER} && ./configure –prefix /usr && make && make install && make clean
#RUN rm -rf librdkafka-${LIBRD_VER} && rm -rf v${LIBRD_VER}.tar.gz && apk del .make-deps
##########################################
######### optimised Size with proper cleanup #################
# U need to install deps, build the library, and uninstall the deps in single command so that image size not polluted by these deps, example: if you run 'apk del' as separate RUN command , size does not reduce.
# as docker works on concepts on layers, each run adds to layers and u cant delete prev layer -> https://github.com/gliderlabs/docker-alpine/issues/186
# so we need to install deps, build librd kafka and then uninstall/cleanup the deps in single command to keep size less.
# Size of docker image > 250 MB without this logic, with this logic ~53MB
# for debugging run separately each command instead of anding them.
RUN apk add –no-cache –virtual .make-deps bash make wget git gcc g++ && apk add –no-cache musl-dev zlib-dev openssl zstd-dev pkgconfig libc-dev && wget https://github.com/edenhill/librdkafka/archive/v${LIBRD_VER}.tar.gz && tar -xvf v${LIBRD_VER}.tar.gz && cd librdkafka-${LIBRD_VER} && ./configure –prefix /usr && make && make install && make clean && rm -rf librdkafka-${LIBRD_VER} && rm -rf v${LIBRD_VER}.tar.gz && apk del .make-deps
################################################################
RUN export PKG_CONFIG_PATH=$PKG_CONFIG_PATH:/usr/lib/pkgconfig/
ENV PKG_CONFIG_PATH=$PKG_CONFIG_PATH:/usr/lib/pkgconfig/

view raw

dockerfile

hosted with ❤ by GitHub

Any feedback is always welcome.

Kafka – Restoring Under replicated Partition & Broker to ISR

Kafka – Restoring Under replicated Partition & Broker to ISR

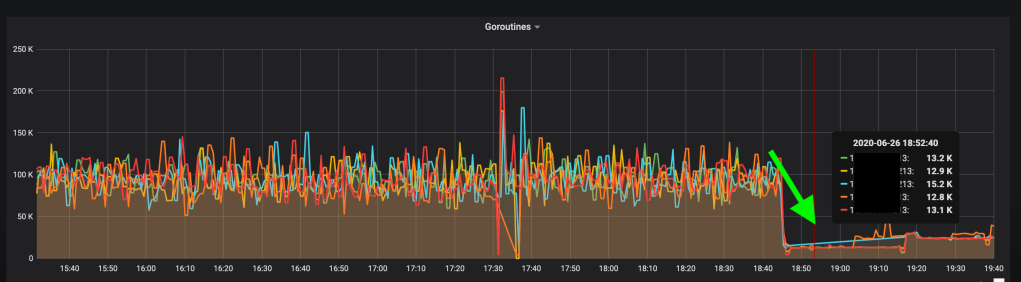
I recently came across a scenario in kafka where our brokers have been pushed out of the ISR and partitions have been declared under replicated. This situation has been going on for weeks & our brokers cant seem to catch up. Due to this paralysis, partition reassignment is also failing/stuck.

Inspired by this blog post on kafka storage internals, i came up with a procedure to bring the brokers back into ISR.

Before i go into the procedure, here are few things to understand:

  1. Offset of message in a partition remains the same both in the leader broker and replica broker.
  2. Position of message having a certain offset in the log file in leader broker may or may not be the same in replica broker. It does not matter if the position matches or not because a consumer is only interested in offset not where its located in the file. But in practice, based on my tests, i have noticed its the same and i believe it should be the same.  if a message with offset 0 in leader broker, is say 10 bytes in length, offset 1 should be at position 11, so i would think the same applies to replica broker as messages are ordered and storing the message at a different position in replica broker does not make sense, it complex to have such logic.
  3. There are 3 important files in a broker log.dir to take note of :
    1. replication-offset-checkpoint -> for a topic partition, the broker stores the latest offset it has successfully replicated.
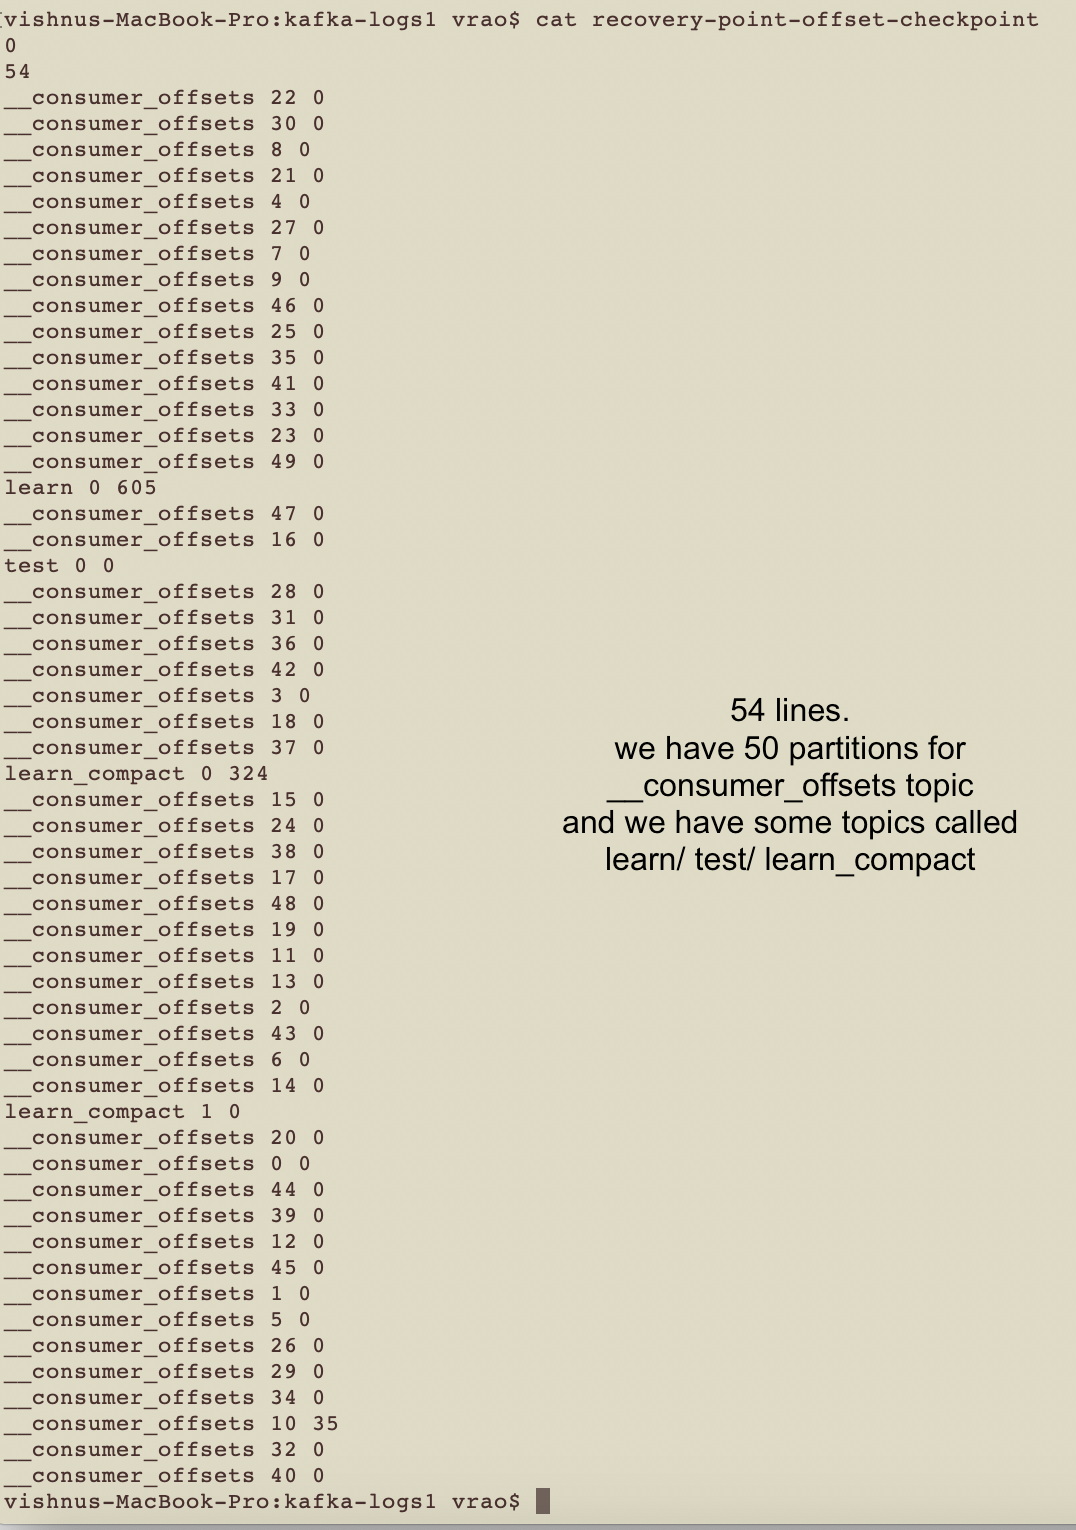
    2. recovery-point-offset-checkpoint -> for a topic partition, broker stores/tracks which messages (from-to offset) were successfully check pointed to disk.recovery-point-offset-checkpoint.
    3. log-start-offset-checkpoint -> for a topic partition, broker stores the first/earliest offset it has available at the moment. refer here.
    4. The format of the above 3 files is the following:
      1. first line is version
      2. 2nd line = number of info lines
      3. each line has topic name followed by partition followed by offset

Screenshot 2020-03-31 at 16.00.13

Test Conditions to induce Under replication:

  1. 3 brokers, 1 zookeeper (kafka_2.12-1.1.0/ zookeeper-3.4.13)
  2.  ./kafka-topics.sh –create –topic test_isr –partitions 2 –replication-factor 2 –zookeeper localhost:2181
  3. broker with id’s : 0, 1, 2
  4. ./kafka-producer-perf-test.sh –throughput 1000 –record-size 1024 –topic learn_compact –num-records 100000 –producer-props acks=1 bootstrap.servers=192.168.0.167:9092,192.168.0.167:9093,192.168.0.167:9094

Screenshot 2020-03-31 at 16.28.35Screenshot 2020-03-31 at 16.28.45

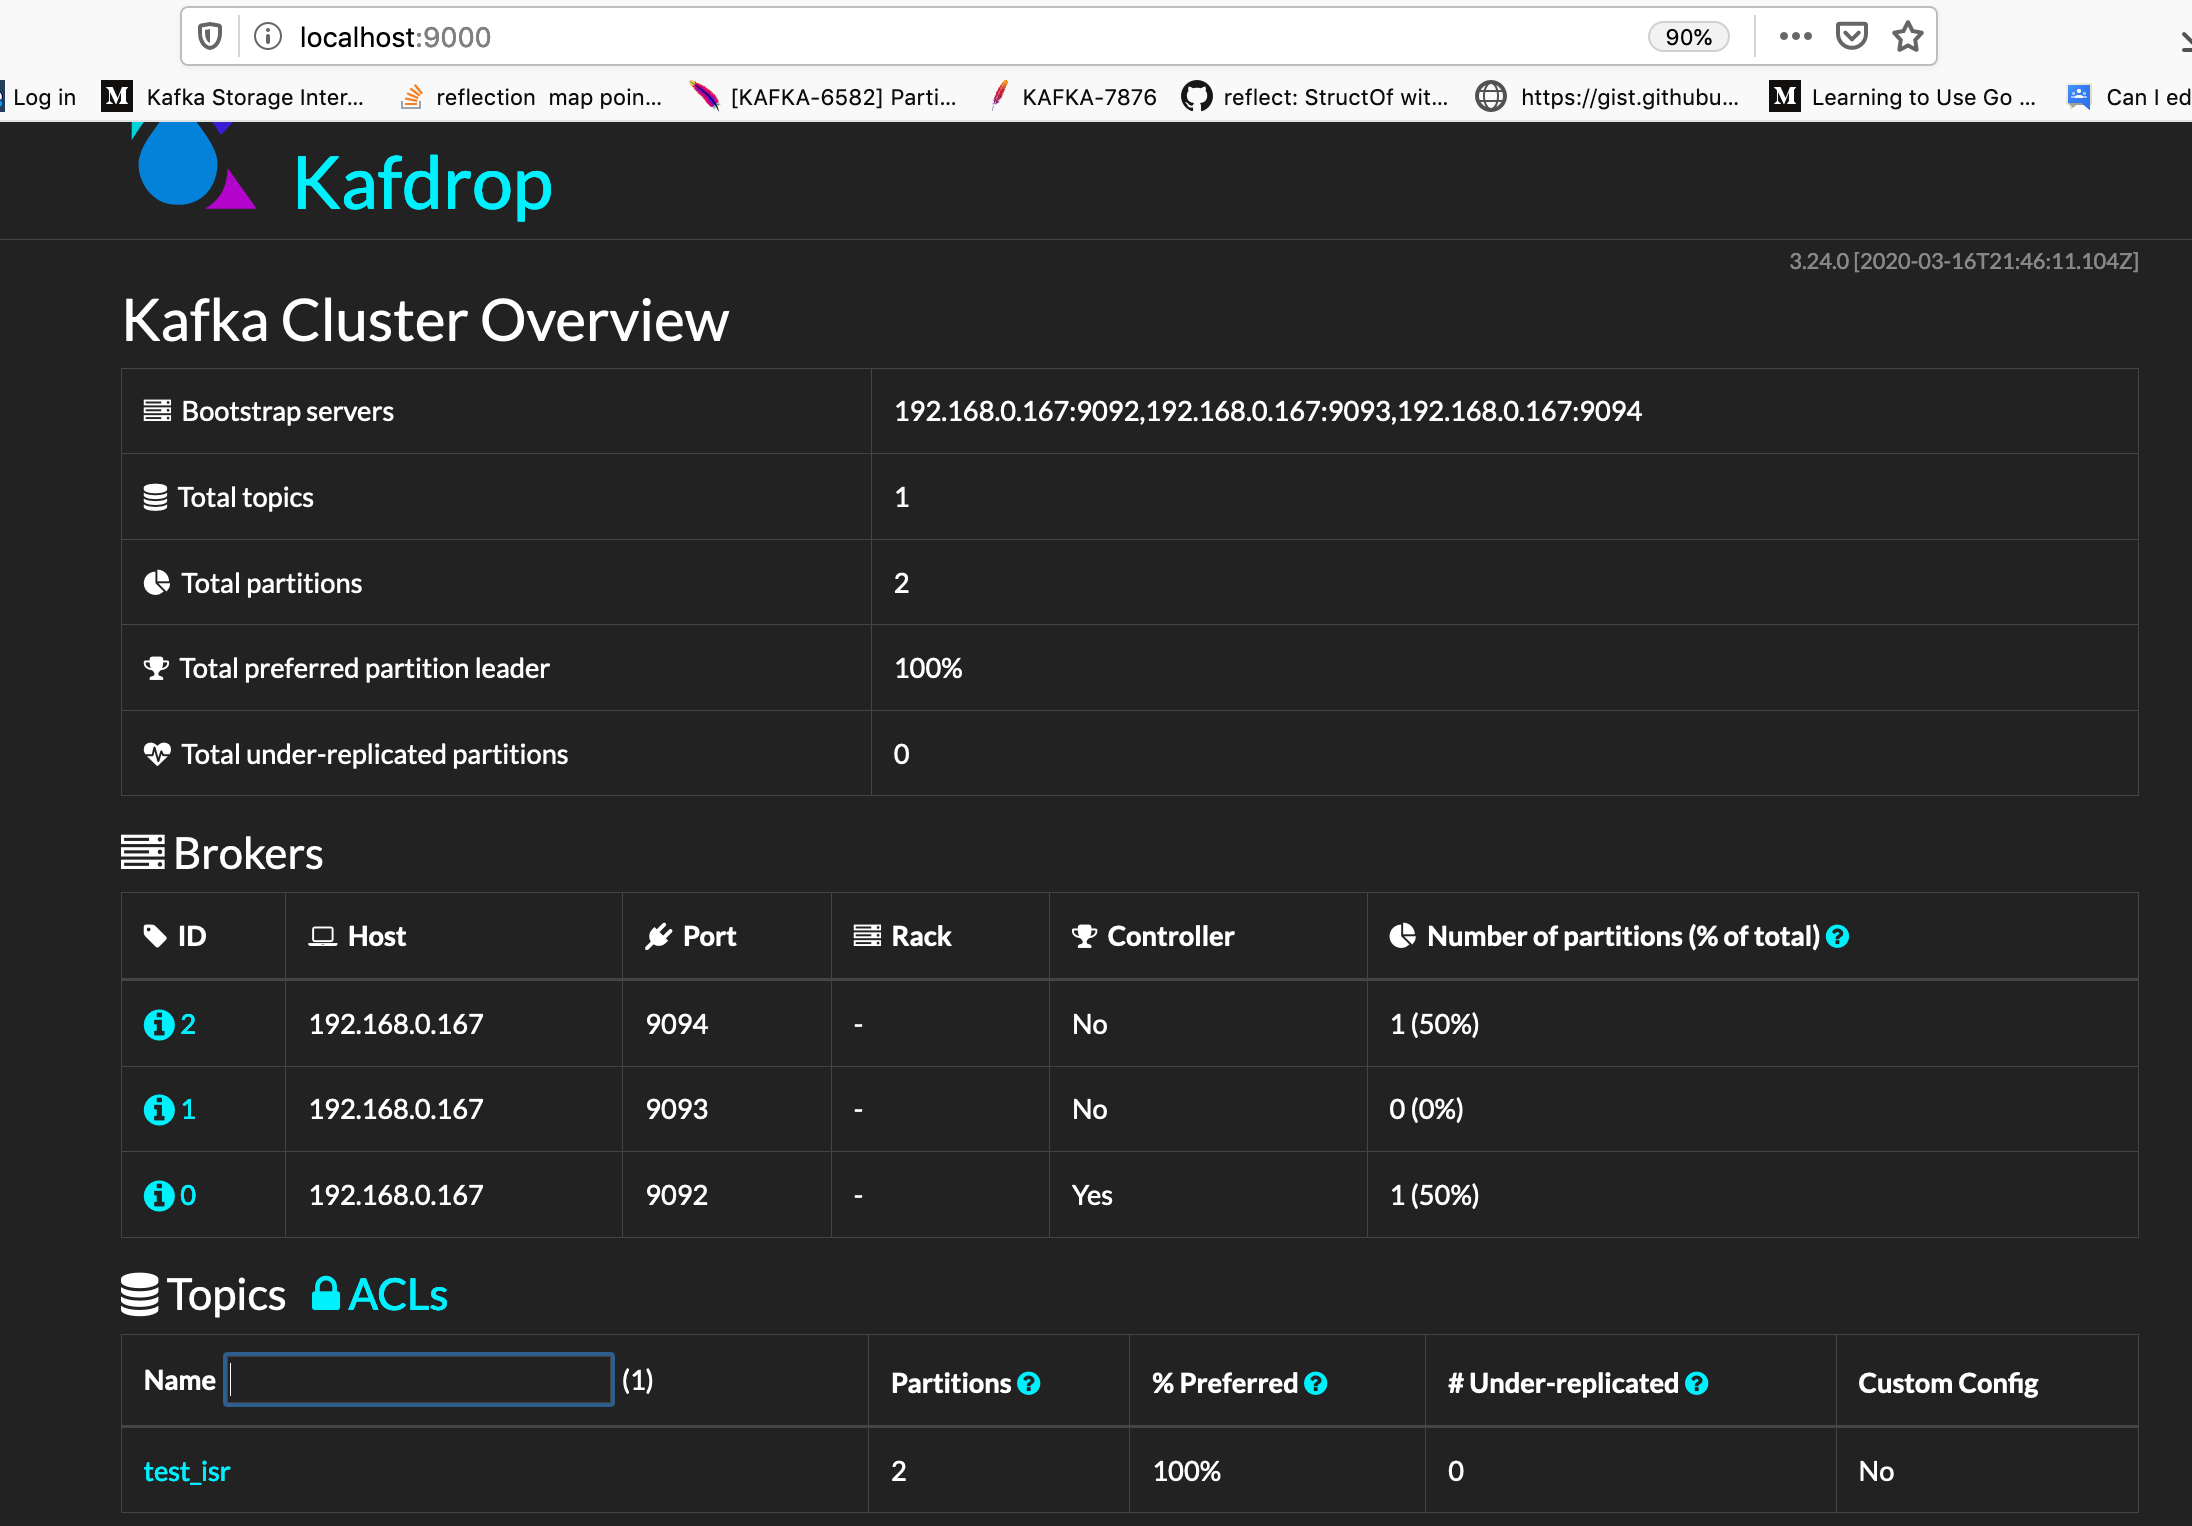
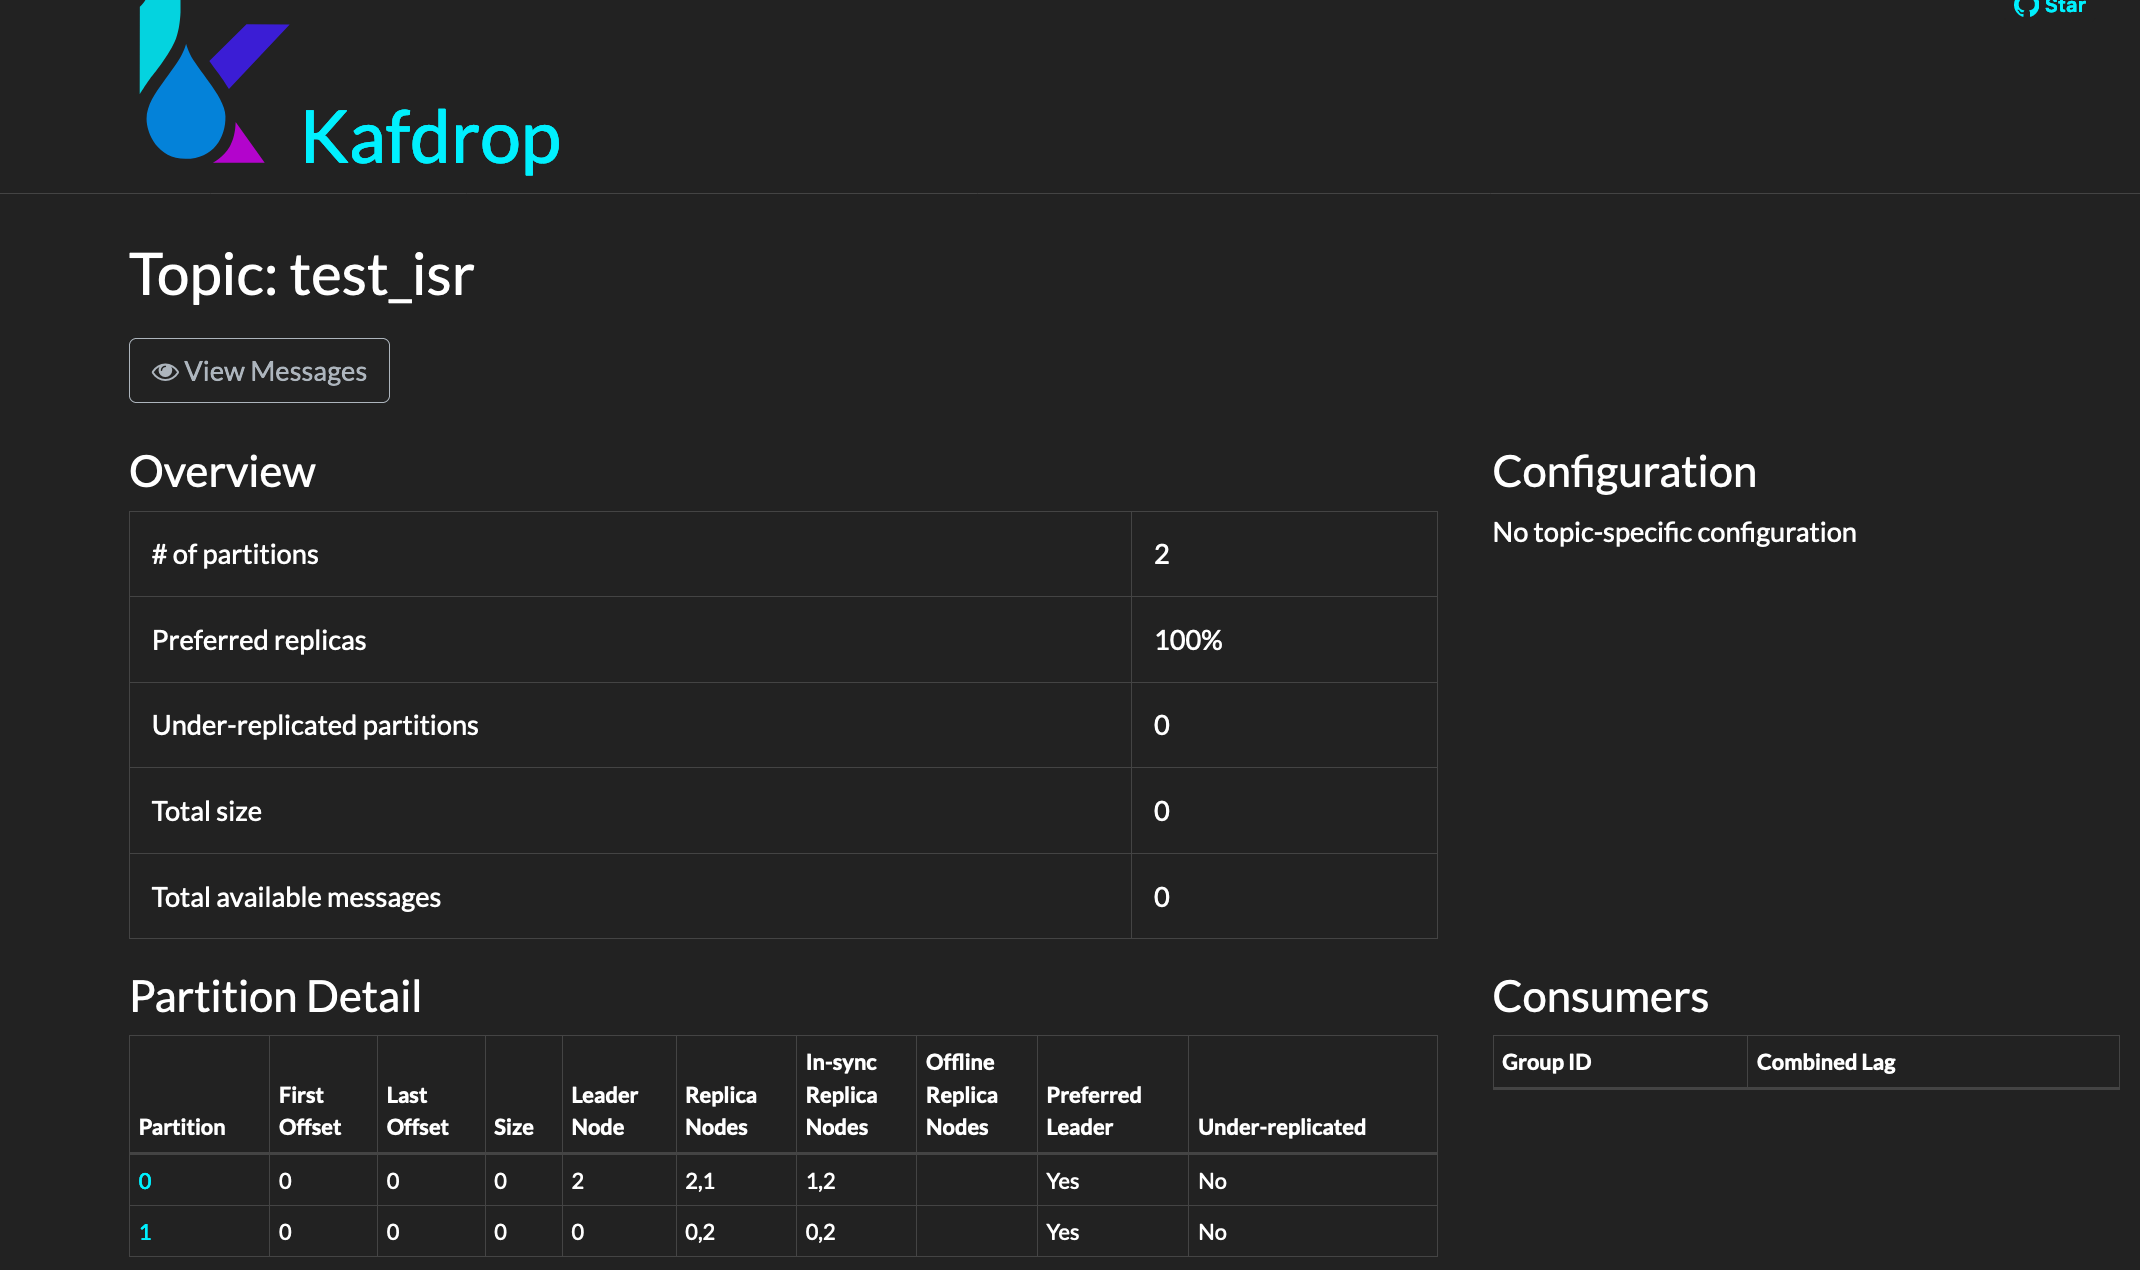
We notice here that brokerId: 1, is not a leader. lets focus on this guy for test simplicity.

Test Starting:

  1. brokers up
  2. start the perf producer
  3. after 2 iterations of producing stop/kill broker id: 1,
  4. wait for perf producer to finish.
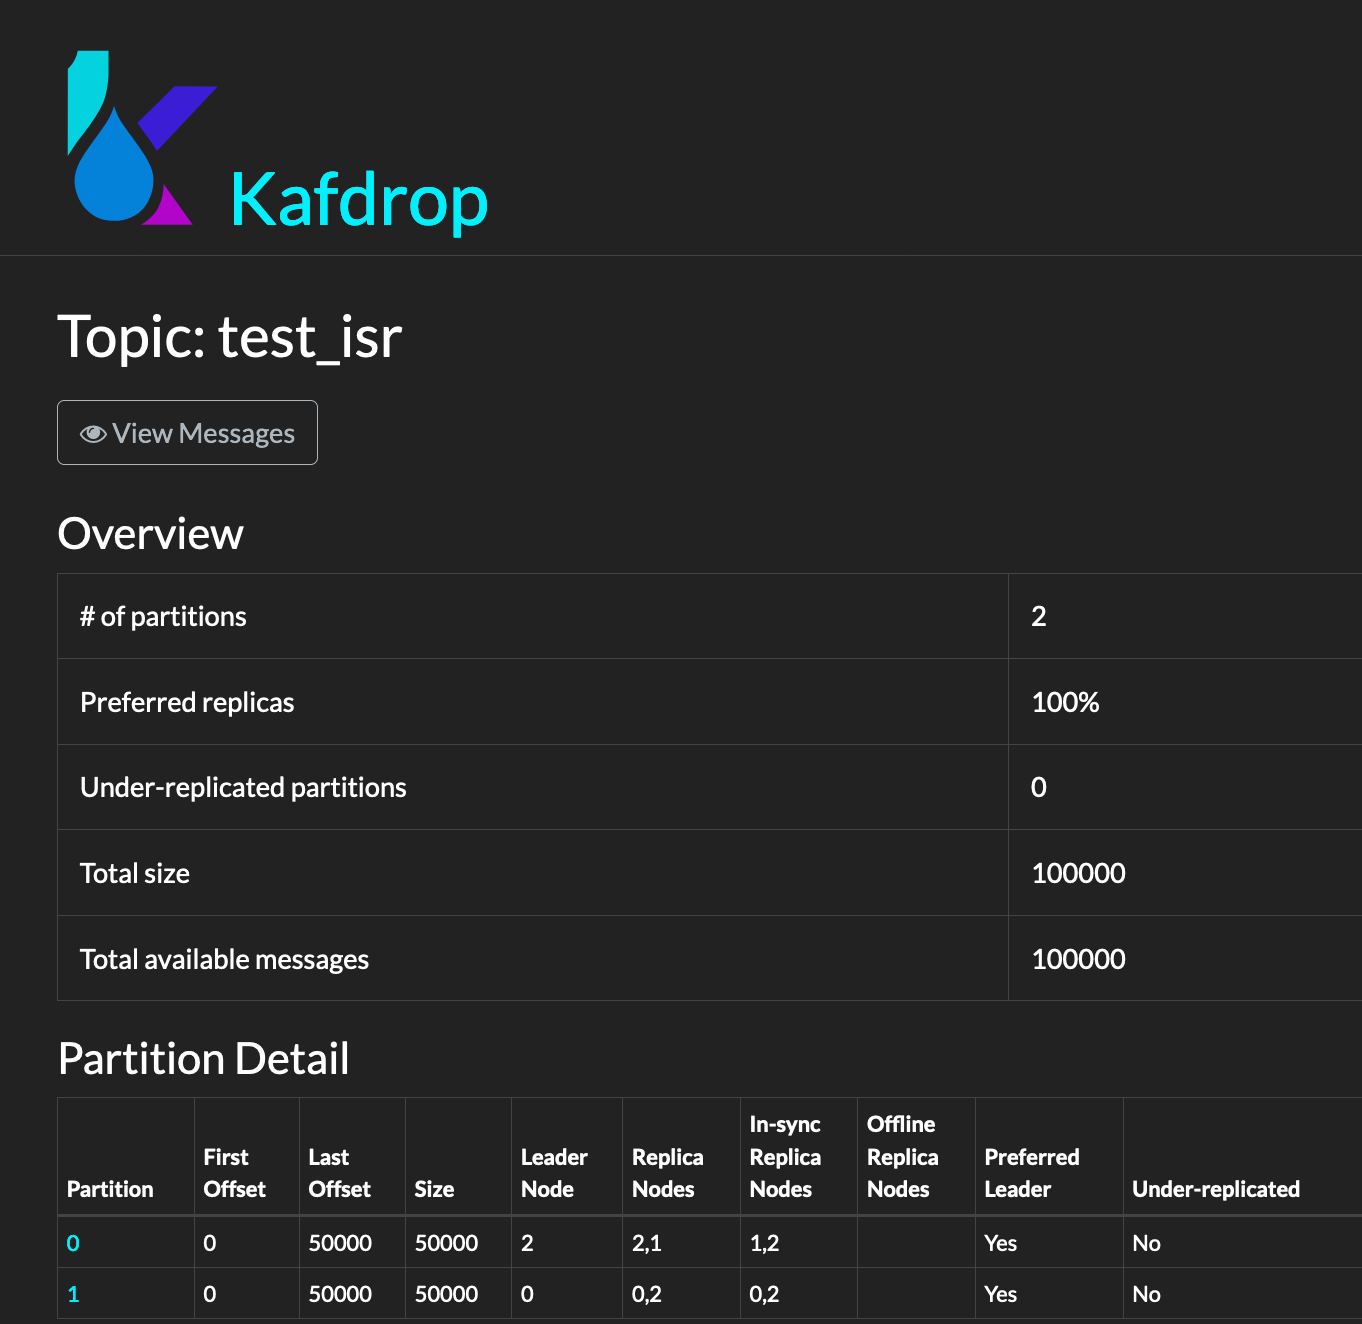
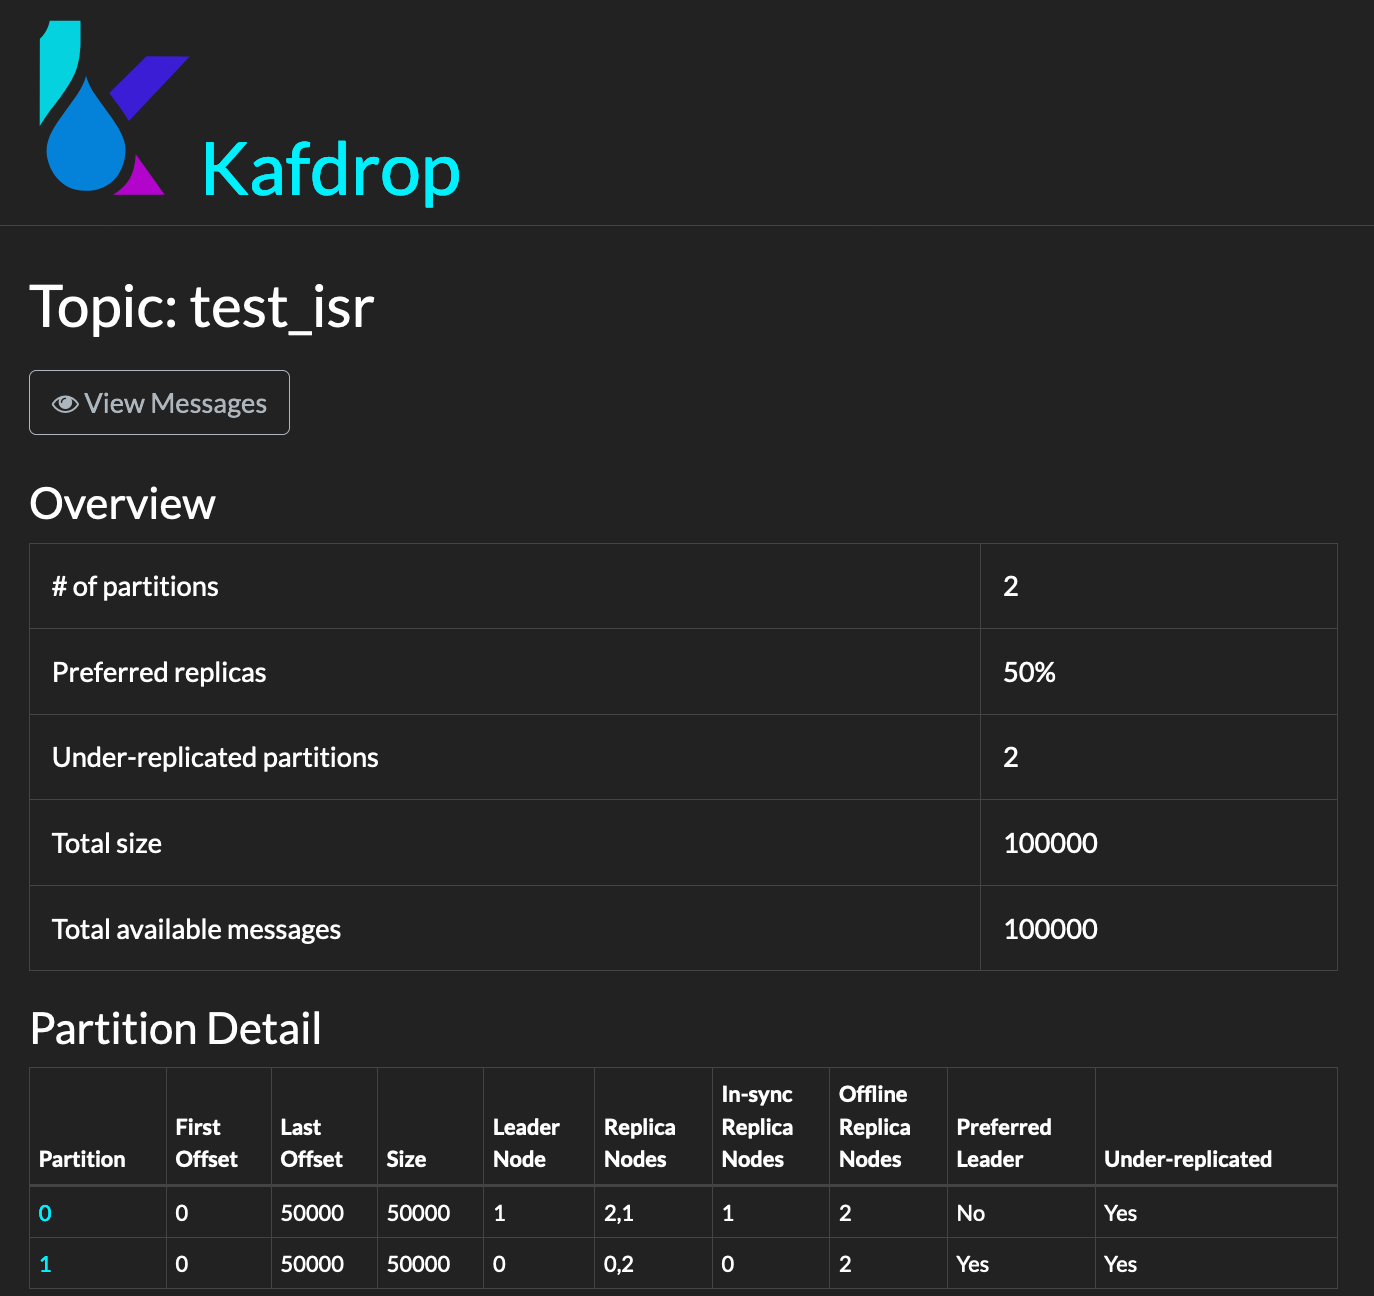
  5. You shall notice that brokerid: 1 is now out of ISR and partition 0 is under replicated.

Screenshot 2020-03-31 at 16.38.46

Screenshot 2020-03-31 at 16.41.45

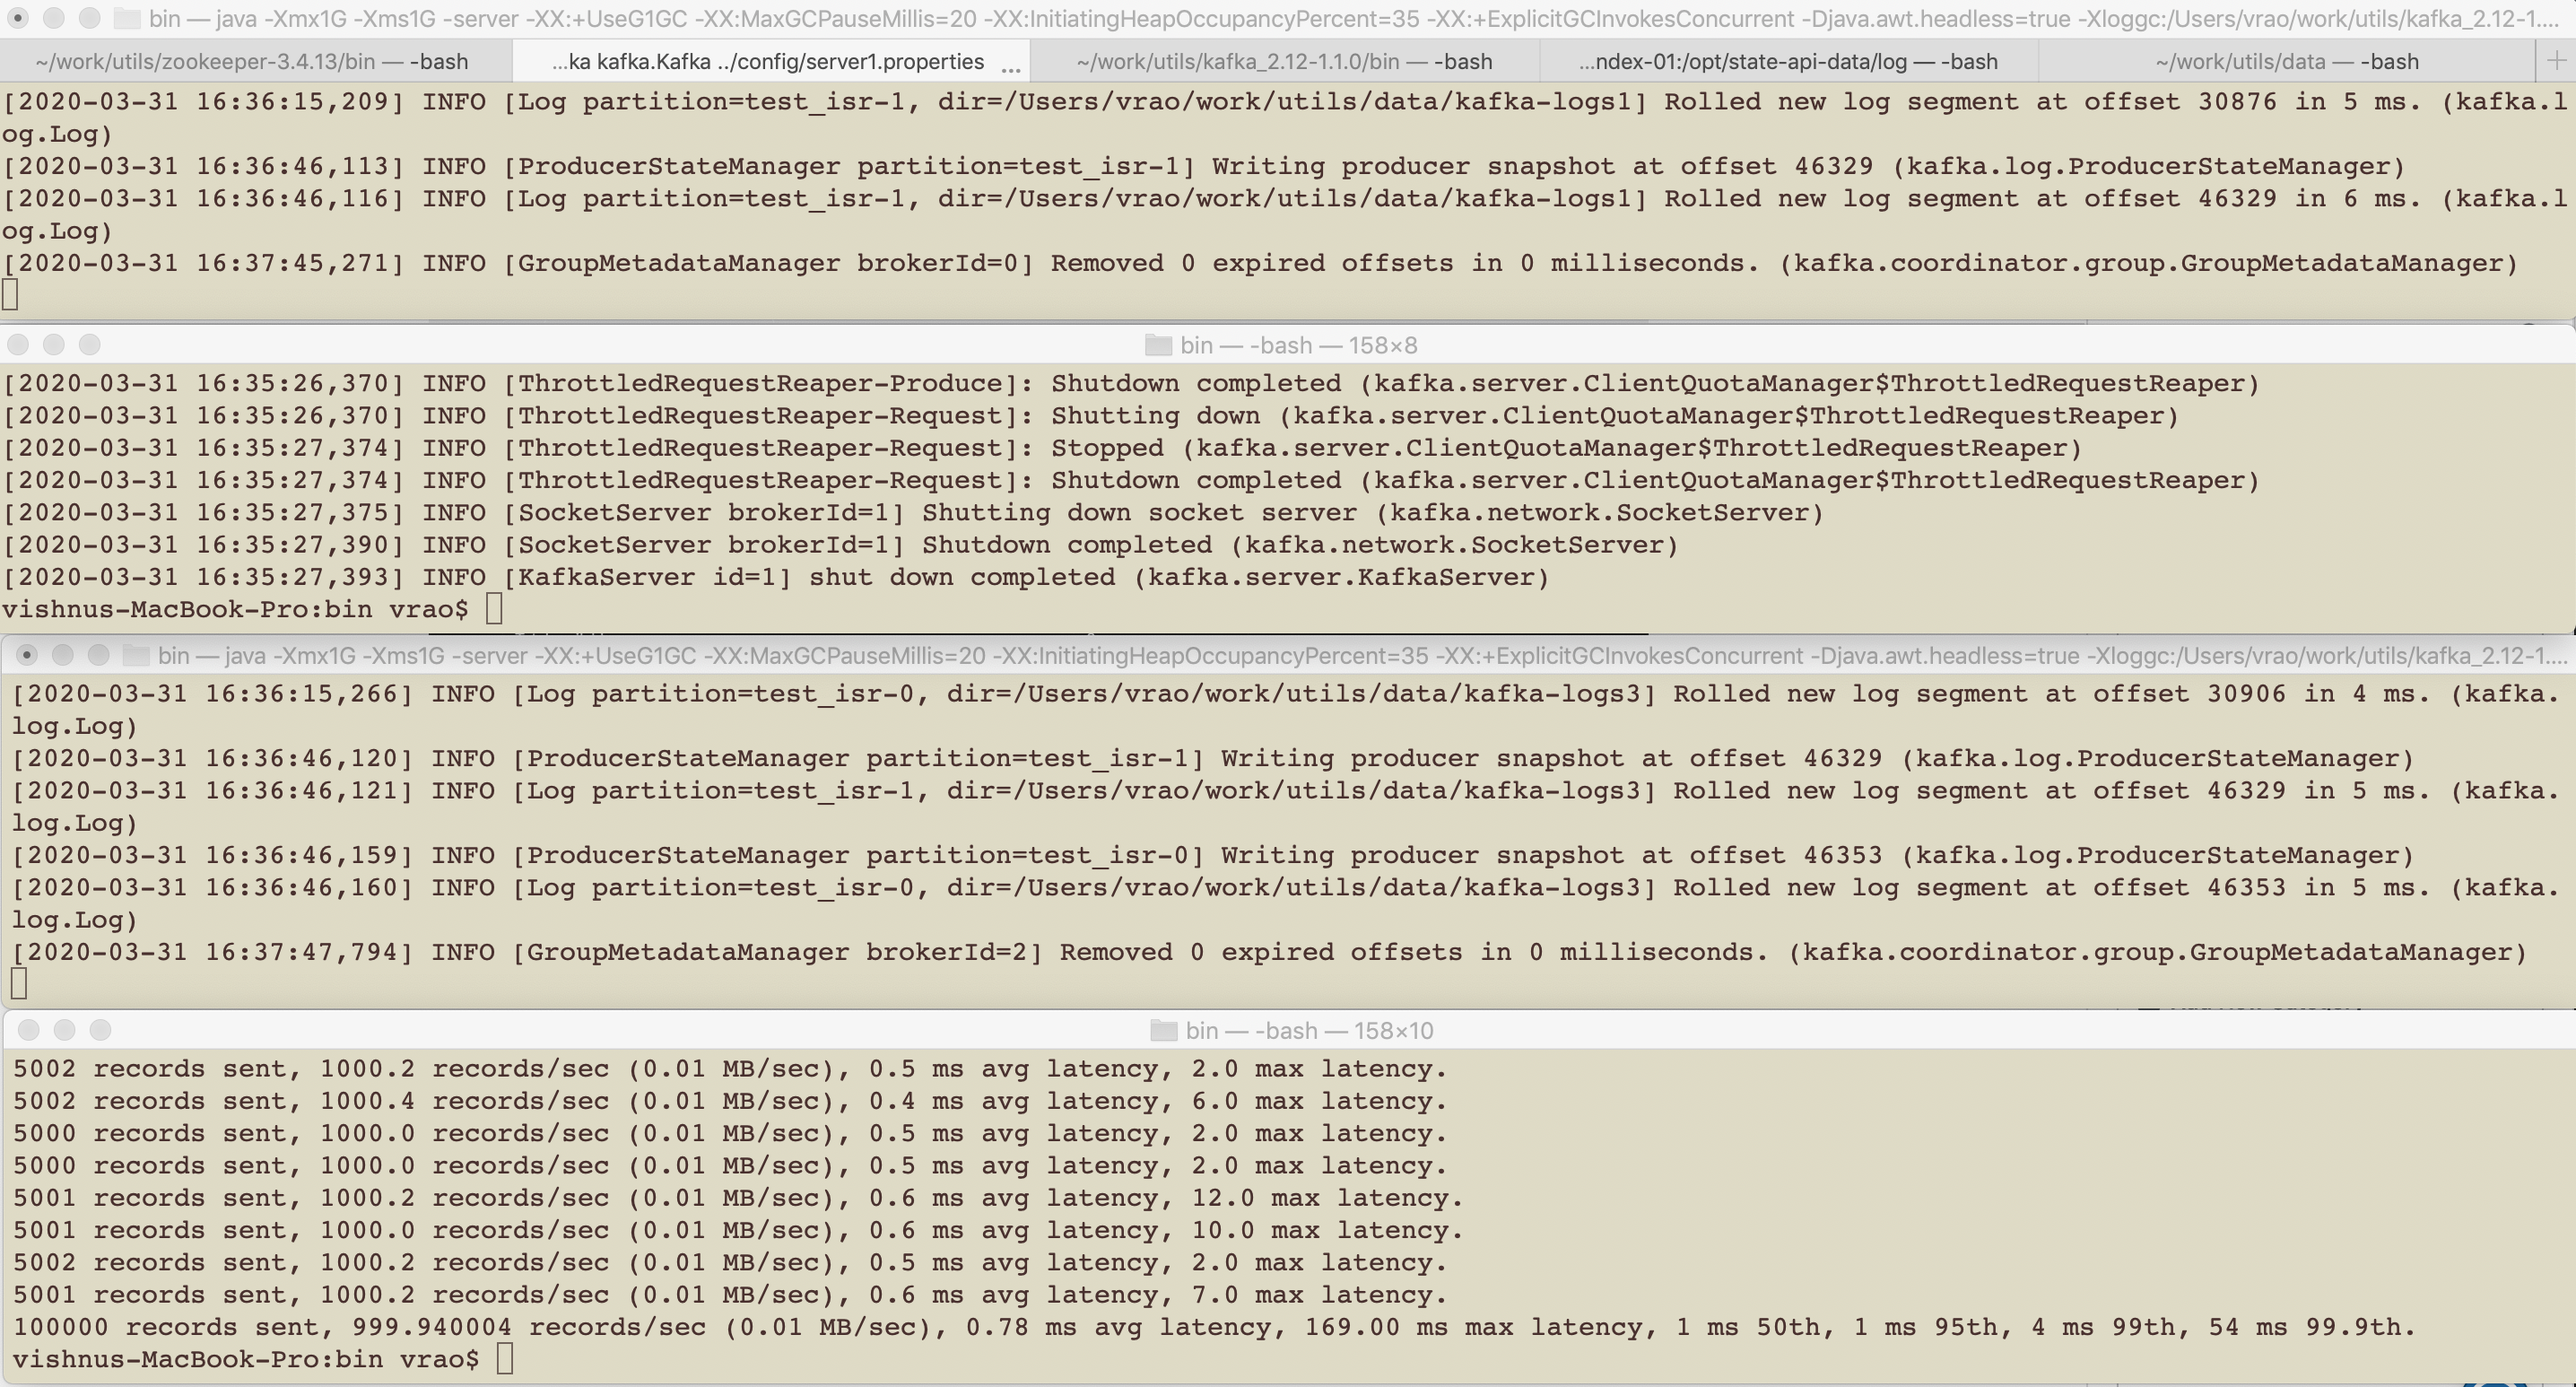
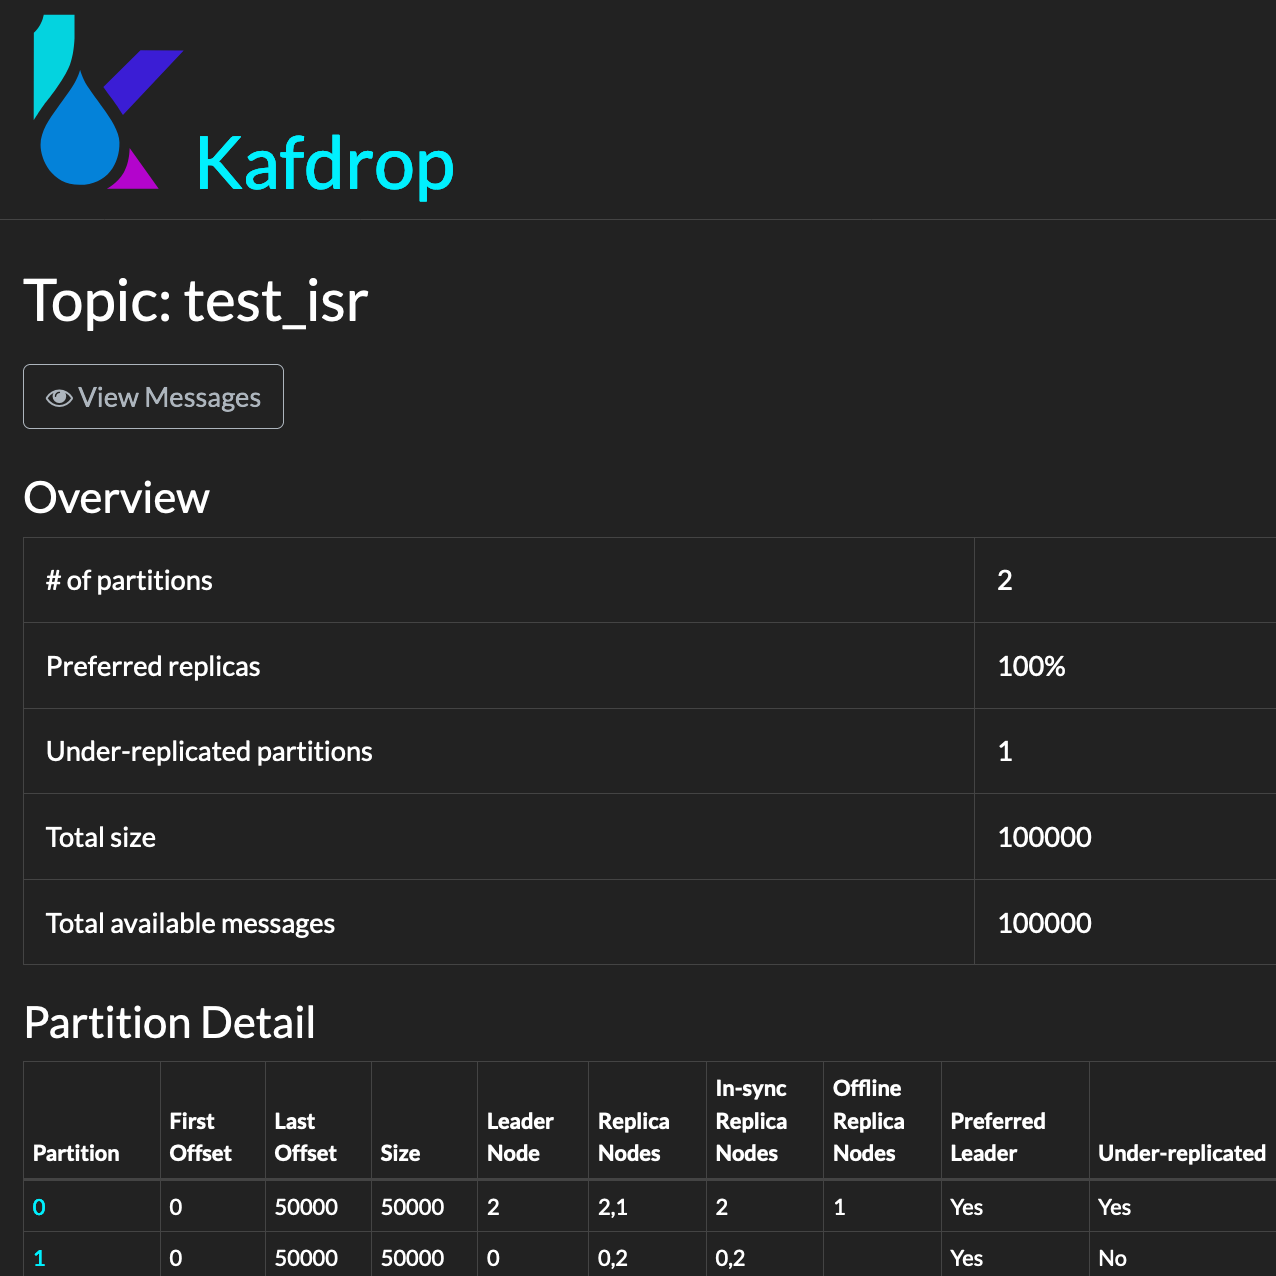
Broker 1 is out of ISR & partition 0 is under replicated and we have 100k messages published.

Recovery for Partition 0:

Note: my kafka log dirs is for brokers 0 , 1, 2 are following respectively

  •    /Users/vrao/work/utils/data/kafka-logs1.  –> broker 0
  •    /Users/vrao/work/utils/data/kafka-logs2.  –> broker 1
  •    /Users/vrao/work/utils/data/kafka-logs3.  –> broker 2

On broker id : 1

1. Go to the partition dir and move existing data to a backup dir.

  1. mkdir /tmp/backup_test_isr-0;

  2. mv /Users/vrao/work/utils/data/kafka-logs2/test_isr-0/* /tmp/backup_test_isr-0/

2. Stop Leader Broker i.e brokerId 2. (i.e. stop further writes)

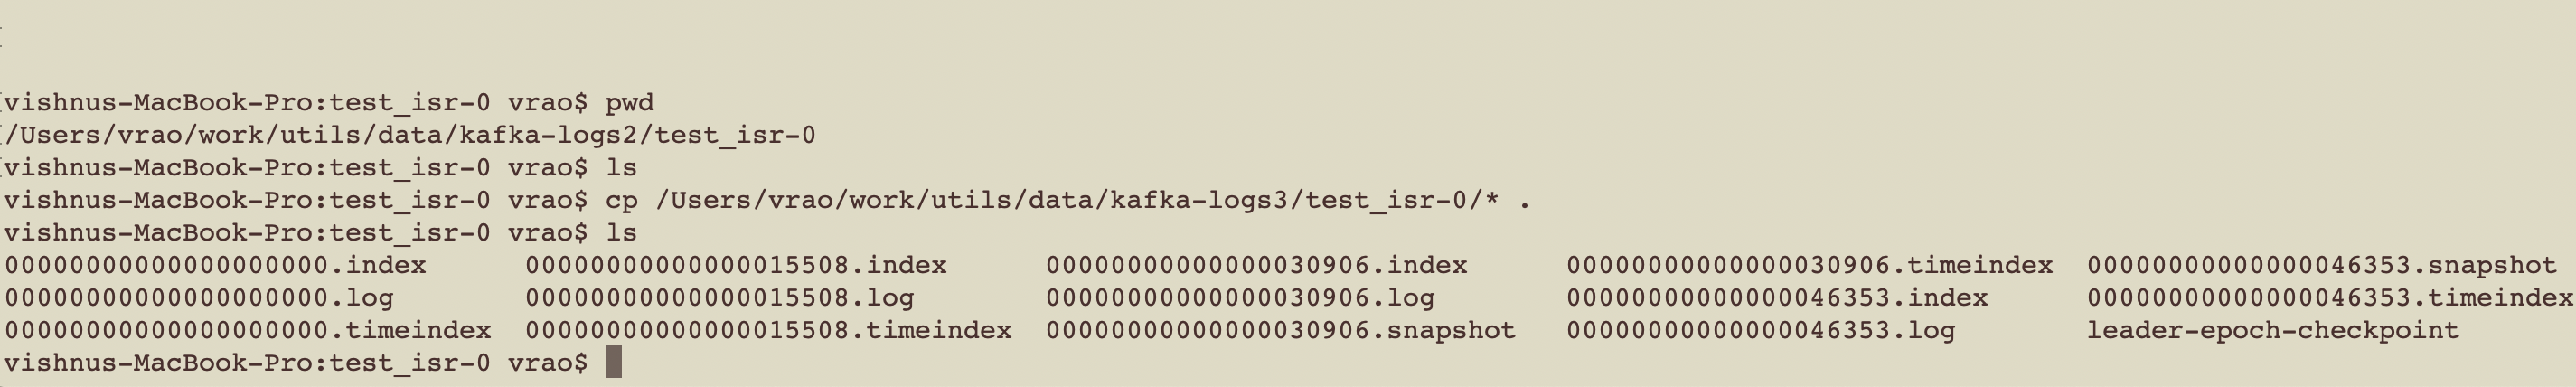
3. Copy data from of partition 0 from broker 2 to broker 1:

Screenshot 2020-03-31 at 17.06.02

4. Now Find the latest replicated offset in brokerId 2 from replication-offset-checkpoint file.

Screenshot 2020-03-31 at 17.08.06

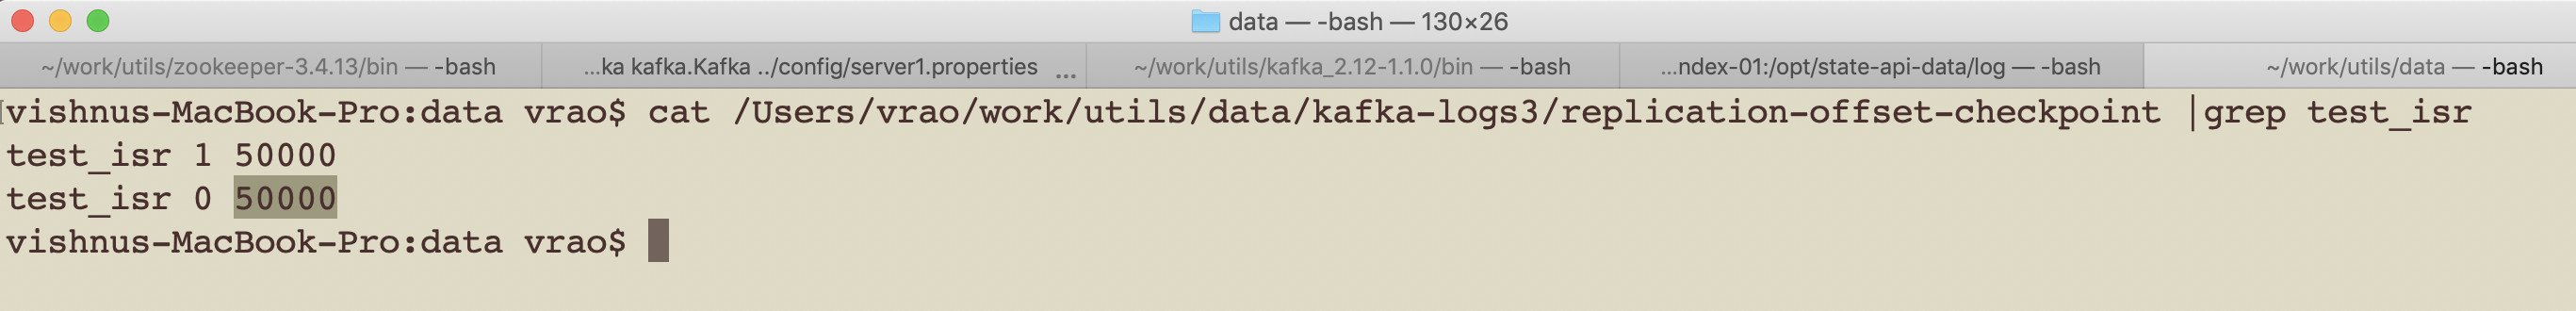
its 50000 for partition 0 of topic test_isr

4.1 Now edit replication-offset-checkpoint of broker 1 and update the value to 50000.

Before editing, you will notice the offset it has replicated is less than 50k i.e.

Screenshot 2020-03-31 at 17.10.08

Now modify file and update 5514 to 50k. (5514 means it was able to replicate successfully upto offset 5514).

After modification file should be as follows:

Screenshot 2020-03-31 at 17.12.00

5. Now Find the latest check pointed offset in brokerId 2 from recovery-point-offset-checkpoint file.

Screenshot 2020-03-31 at 17.13.37

5.1 Now edit recovery-point-offset-checkpoint of broker 1 and update the value to 46353.

Before editing, you will notice something like

Screenshot 2020-03-31 at 17.14.41

Now modify file and update 5515 to 46353. (5515 means it was able to checkpoint successfully upto offset 5515).

After modification file should be as follows:

Screenshot 2020-03-31 at 17.15.56

6. Now follow the same steps (5/5.1 or 4/4.1) with the file log-start-offset-checkpoint 

i.e. <log.dir>/log-start-offset-checkpoint

Make sure that the offset for partition 0 for our topic in leader broker is the same in replica broker.

i.e. copy the value of partition 0 from /Users/vrao/work/utils/data/kafka-logs3/log-start-offset-checkpoint  to /Users/vrao/work/utils/data/kafka-logs2/log-start-offset-checkpoint.

If the file is empty or has no data , then u have nothing to do 🙂

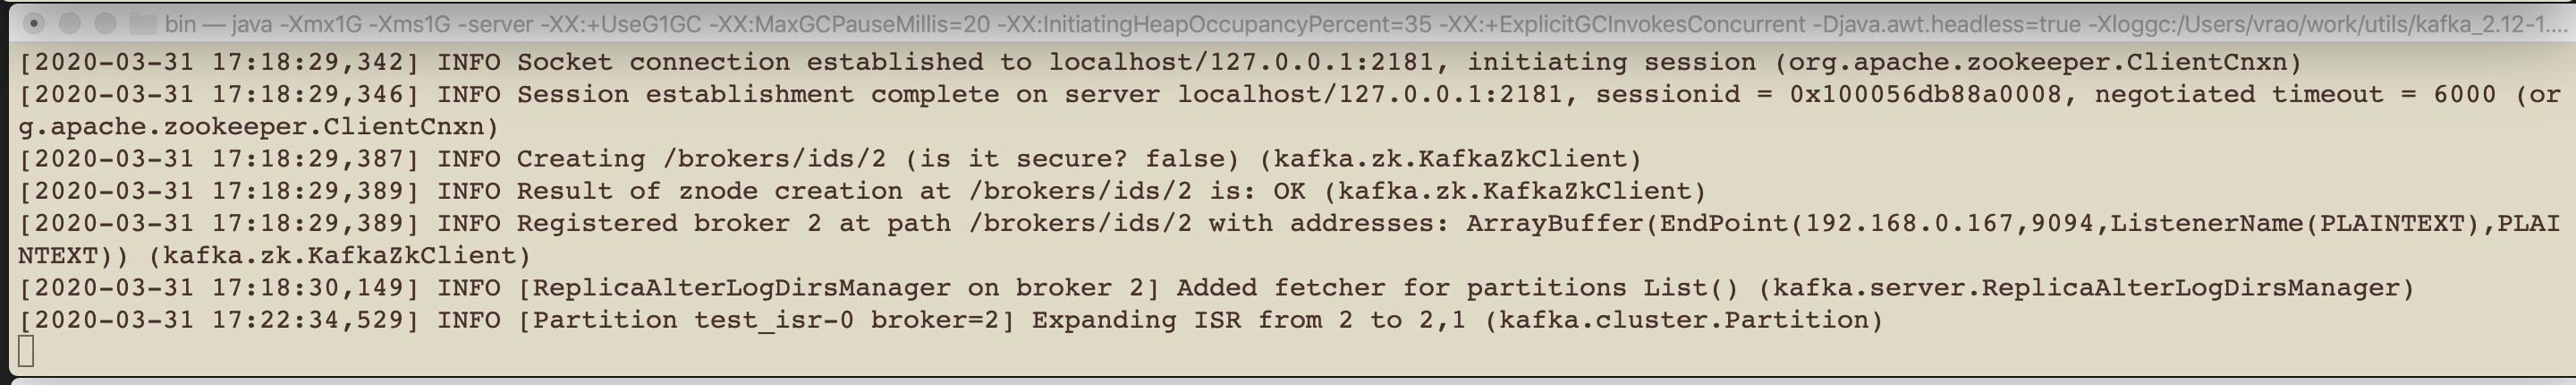
7. Now we are ready to start broker id: 1

You will notice it joins cluster and ISR has expanded back !

Screenshot 2020-03-31 at 17.25.37Screenshot 2020-03-31 at 17.22.53

8. Now lets verify if things are good with regard to number of messages.

Shut down the leader node i.e. brokerId: 2 so that our replica becomes the new leader.

From our test partition 1 was never affected so it will have 50k msgs and now our replica has become leader for partition 0 i.e. for other 50k msgs.

so we should get 100k msgs.

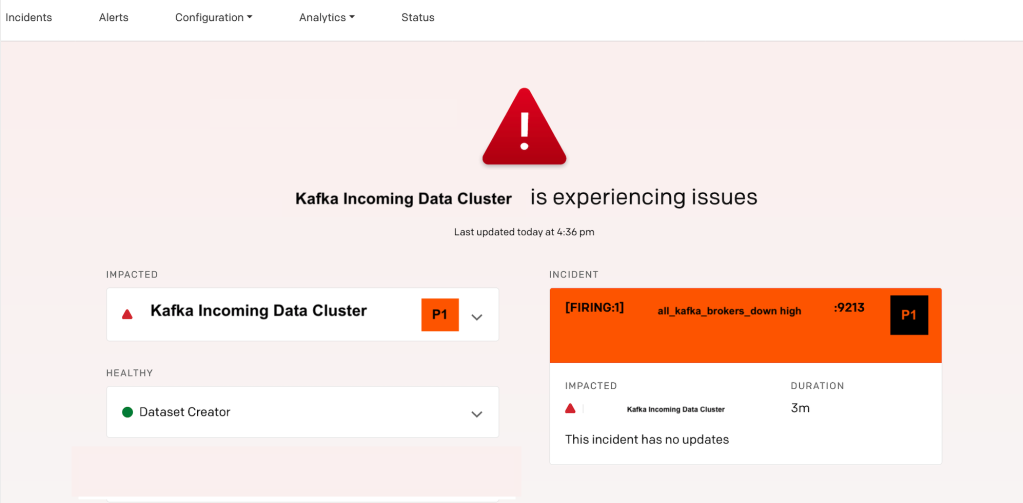
The following screenshot shows that our replica is now leader (brokerId :1 is leader) and erstwhile leader is offline.

Screenshot 2020-03-31 at 17.29.40

9. Now start a consumer to the topic and you should get 100k msgs.

./kafka-console-consumer.sh –topic test_isr –bootstrap-server 192.168.0.167:9092,192.168.0.167:9094 –from-beginning

Screenshot 2020-03-31 at 17.36.02

So recovery is complete ! We were able to recover data from the erstwhile out of ISR broker and partition is no longer under replicated.

Ps: i did a video recording for same scenario for 50k msgs here, u can find part1 here and part2 here

Ps: I have seen some blog posts where people manually move data and edit the checkpoint files & recover brokers. i hope the above steps are logical . Hope to try in production! Will update if i do. From my test, things look promising.

and as always feedback is welcome.


———————————————————————————————————————————————————————————-

References:

My thanks to the authors of :

View at Medium.com

https://medium.com/@durgaswaroop/a-practical-introduction-to-kafka-storage-internals-d5b544f6925f

http://ixiaosi.art/2019/05/20/kafka/kafka启动分析/

https://stackoverflow.com/questions/35407090/explain-replication-offset-checkpoint-and-recovery-point-offset-in-kafka

for some details on log-start-offset-checkpoint u may see refer to this kafka confluence page too. Search for ‘log-begin-offset-checkpoint’

Tools used:

https://github.com/obsidiandynamics/kafdrop