We at eyeota are currently running a single cluster across multiple aws regions. its a global cluster but we have key spaces specific to each region i.e. Apps local to a aws region write/read to/from their corresponding key space (Example keyspace: us-east-1_txns, Apps in us-east-1 would interact with this key space only). Few key spaces (i.e. the smaller sized ones like Singapore) have cross dc replication.
we use scylla 3.0.8 on Linux 5.1.15-1.el7.elrepo.x86_64.
The class of instances used was i3.en /i3, but size differed from aws region to aws region – i3.x.large / i3.en.xlarge to i3.en.6xlarge (but within each aws region , the instance type is homogeneous). The amount of traffic/ data varies from region to region, hence the use of different instance types. We used i3.x.large in Singapore because i3.en was not available and used the same class in Sydney as well because we had cross dc replication between AU & SG.
Here is a brief summary of how we setup up the clusters in different data centers:
- scylla provides an AMI for us to use in aws but, its not available for all regions. hence we created an AMI using that AMI -> one ami for all.
- In each region, we have nodes in different availability zones.
- We fired up the instances in different aws regions using our AMI & started scylla.
- We migrated data from our old data store to scylla. We wrote a custom app which reads from old data store & inserts/updates records to scylla.
- After migration, Disk usage for the ssd was about 40-50% on each node.
- We use leveled compaction strategy, with new mc format on & chunk size=4KB.
- The size of record / number of records varies from region to region & we used appropriate i3.en class for each region . US-east have bigger class machines when compared to Australia because traffic is higher hence more data.
- Since we needed to expand in each region , we had to add nodes in each region.
- We decided to expand/add nodes in aws Frankfurt first before moving to the big US-east (i3.en.6xlarge).
- Note: The new node had auto_bootstrap = true & we did not do a node rebuild.
Now bear in mind, while adding a node, Reads/Writes were enabled on the nodes in Frankfurt !!! i.e. live traffic is flowing to the nodes.
From here things went slow and slow…..
When we added a node to Frankfurt (i3.en.2xlarge), we expected the node to go into UN mode in 1/2 days, but it did not. At this point we were worried, & going by estimates, we expected it to complete in 7 days, which was not viable.
Now we felt, if this was the case for Frankfurt, then it will take even more time for our US-east nodes to join 😦
We immediately started to debug:
- iftop (network incoming bytes) – which was low – streaming from 2-3 boxes from same AZ.
- sar -d 1 (iowait around 0.21) – not high either on both source nodes & joining node.
- load average at a maximum. ‘x’ on a ‘x’ core box.
- scylla logs – the usual. no errors, only info about compaction & streaming.
Now we began to wonder, was the setup run properly ?
- We noticed that scylla_ami_setup failed to run. (we went thru the scripts & found out it was not a big deal if the ami setup failed)
- We noticed when we ran scylla_setup it failed too. see bug (this too was not a big deal)
- Our raid was set up properly on all hosts.
- RAID setup was also done on i3.en.xlarge => RAID on a box with 1 disk.
- Redundant Array of Independent Disks with 1 disk, hmm there is no redundancy here but anyways. it standard set up everywhere.
- RAID setup was also done on i3.en.xlarge => RAID on a box with 1 disk.
- Our cpu set was set to all the cores based on instance type as decided by scylla_setup script & network interrupts in mq mode based on instance type.
- Our io_properties.yaml was good too.
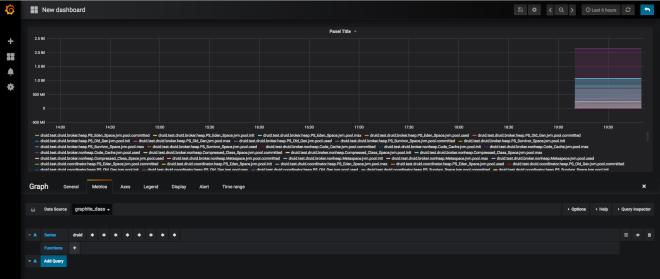
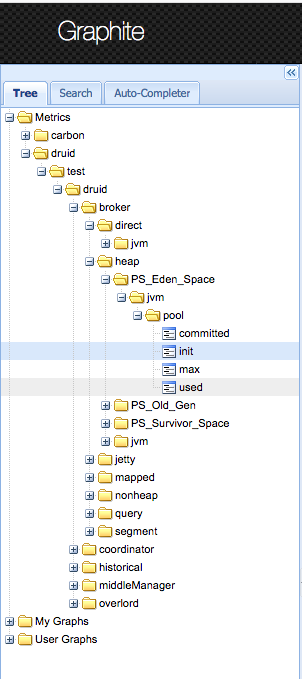
- the scylla dashboards , we took from scylla monitoring. we mostly looked at ‘scylla_io_queue_streaming_write_total_bytes‘ & ‘scylla_io_queue_streaming_read_total_bytes‘
- The ‘scylla_io_queue_streaming_write_total_bytes’ was always around ‘X’ MB / second where X = number of cores on box, which was interesting like 1MB per core per second. This was consistent across all the instance types we used.
- we noticed FS trim was not running/setup. We did try running fstrim while joining the node once a day but we could not see much difference.
Now when we look at this blog post about time taken to rebuild a scylla node, we obviously were no where near the numbers.
So whats different from the scylla blog post benchmark ?
- record size is a factor ? possibly
- compaction strategy a factor ? possibly when we think of write amplification on disks
- number of records are a factor ? – see this bug
- active reads/writes happening simultaneously on source nodes=> compactions => additional disk activity & CPU usage ==> yes it is a factor.
- We decided to run our own benchmark . we took 2 nodes (i3.en.2x large).
- generated data on 1 node. (each record ~900kB — 600Gb compressed)
- started the 2nd node(auto_bootstrap=true) & it went into UJ mode then eventually to UN.
- Joining time = ~1HR which was awesome.
- Joining time from i3.2x.en to i3.6x.en = 40minutes.
- The results were awesome but this was not the case in prod.
- But, what was missing was in above test was the presence of active reads/writes to simulate production traffic while joining was in progress.
- What we could take away from the test (i3.en.2xLarge to i3.en.6xLarge)was that Number of cores obviously is a factor => CPU.
- looking into github we found the notion of cpu shares for various activities like streaming/compaction etc. The shares are hard coded and there is no way to change /tune them unless we recompile the code. => The idea being , lets give more cpu for streaming which, from the code has the lowest priority. But there are no levers / configuration params to help out streaming.
- After banging our heads doing different things, looking into code it seemed hopeless as disks were definitely not overloaded (in our test above, we saw iowait go to 3.1 (using `sar -d 1`) but production was at 0.21. Also, Network no way was saturated.
Other thoughts in our heads:
1) lets change compaction strategy to size tier as compaction load on the disk would be less when compared to level. We can try , but its painful process to change , not feasible to do in long run and our disks don’t seem loaded.
2) fs trim – lets clean up the ssd disk ? we tried but not much help and in any case we can do at max once per day not per hour.
3) we stopped active reads to help out, but no joy. (we could not stop active writes).
4) For a while we looked at seastar and tried to see if there are any tuning knobs to help out.
5) At times we kind of engaged sometimes in blindly trying out some configuration parameters / black box tuning.
….
Due to project deadlines approaching we had to expand our cluster (in all regions) fast, by any means – hack or crook 🙂
We finally stumbled upon this configuration parameter ‘compaction_static_shares‘ in config.cc
We decided to play with this – going by philosophy ‘HACK or crook‘ https://en.wikipedia.org/wiki/By_hook_or_by_crook
Since compaction shares for streaming is hard coded to 200 in the code.
auto maintenance_scheduling_group = make_sched_group(“streaming“, 200);
we decided to set compaction shares < 200 => that make streaming more important.
So
- We decided to try this out on our Sydney region (i3.x.large)
- we set compaction_static_shares=100 on the streaming source nodes & on the joining node.
- We restarted the source streaming nodes first.
- Then we restarted the joining node, so that it can make fresh connections with the source nodes. (Order of restart is important !)
- we were pleasantly surprised. streaming was moving with a faster pace.
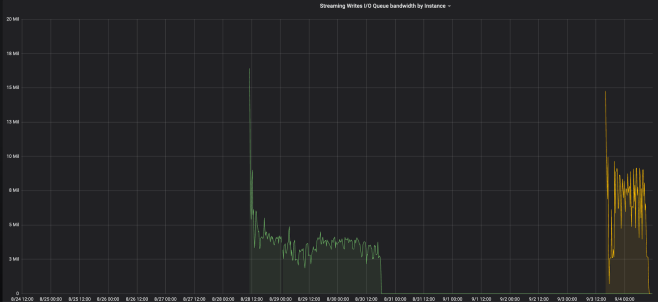
As you can a node in green took about 56 hours vs the node in yellow took about 18 hours.
=> That is a 3X boost !
Note: The partition sizes(bytes, using cfhistograms) for
- Frankurt key space were 50%-924 75%-4768 95%-24501 99%42510- Max-785939.
- Sydney key space were 50%- 2759 75%-14237 95%-61214 99%-152321 Max-1629722.
Armed with this weapon, we started adding other nodes across other aws regions. Once they joined, we removed the setting and restarted the nodes.
But by, lowering compaction cpu share => lesser compactions which lead to an increase in read latency , which was ok for us.
Our objective was to join nodes as soon as possible because of project deadlines, so we chose this approach.
Going by our past experience with traffic patterns, we added a node once in a while, and expect to do so in future as well. Hence we might choose not to employ the usage of this configuration parameter, as there would be no rush to join the cluster. If the node takes 6 days to join in Frankfurt region (i3.en.2x.large), so be it – we are willing to wait.
But having said that, we still are puzzled with the slow joining. (reported this in scylla github)
At the end, the team ( Krishna & Rahul & myself ) enjoyed debugging & learning new stuff.
Thanks for reading the post. If you feel we were were incorrect with regard to certain things in the post – feel free to point out. We would appreciate any feedback /questions.
ps: the post is quite delayed. had a lot of vacations 🙂
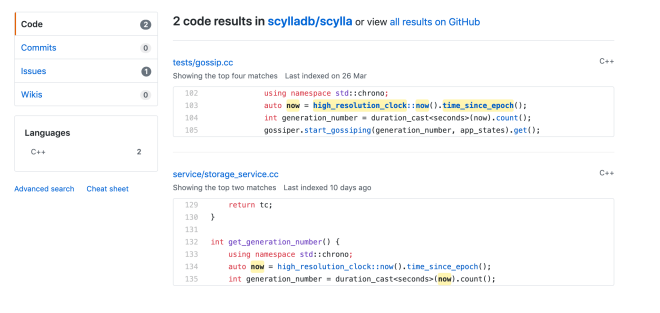
![Scylla : received an invalid gossip generation for peer [How to resolve]](https://mash213.files.wordpress.com/2019/07/screenshot-2019-07-05-at-14.44.46.png?w=619 "Scylla : received an invalid gossip generation for peer [How to resolve]")